

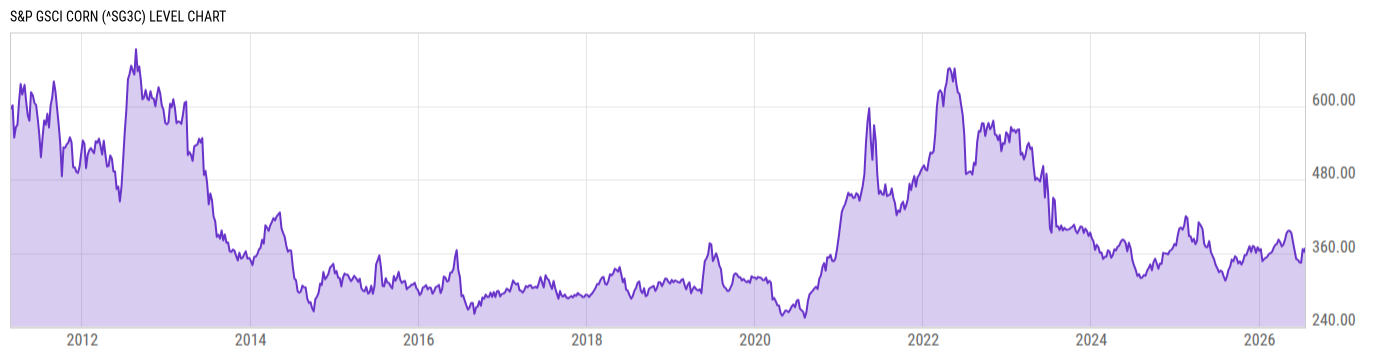
S&P GSCI Corn (^SG3C)
367.18
+2.68
(+0.74%)
USD |
Jul 17, 20:00
Level Chart
Key Stats
Basic Info
| N/A | |
| Core Index Name | S&P GSCI Corn |
| Return Type | Price Return |
| Currency Code | USD |
| Category Hedge Type | Not Hedged |
Index Varieties
| Return Types | |
| Excess Return | S&P GSCI Corn Excess Return |
| Total Return | S&P GSCI Corn Total Return |
Total Return Performance
As of July 17, 2026.
Returns for periods of 1 year and above are annualized.
Annual Performance
As of July 19, 2026.
Basic Info
| N/A | |
| Core Index Name | S&P GSCI Corn |
| Return Type | Price Return |
| Currency Code | USD |
| Category Hedge Type | Not Hedged |
Index Varieties
| Return Types | |
| Excess Return | S&P GSCI Corn Excess Return |
| Total Return | S&P GSCI Corn Total Return |