

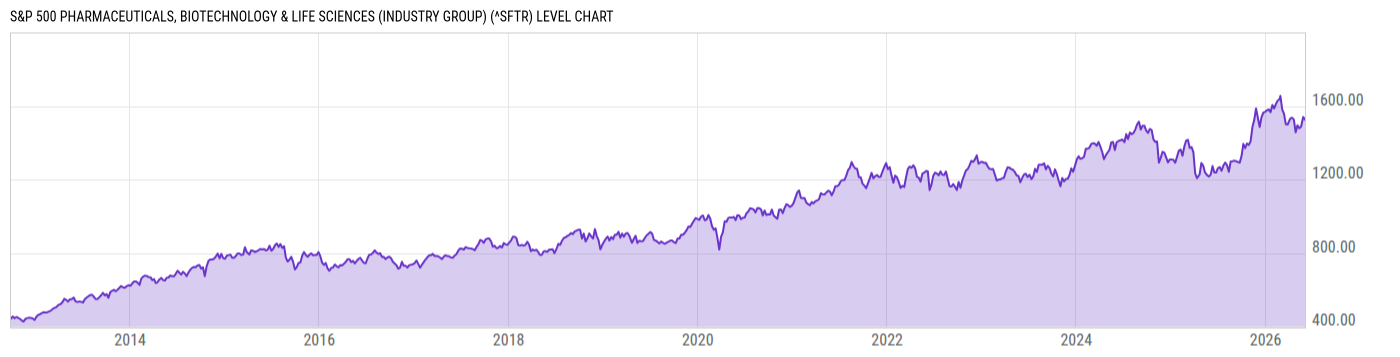
S&P 500 Pharmaceuticals, Biotechnology & Life Sciences (Industry Group) (^SFTR)
1526.11
-16.78
(-1.09%)
USD |
Jun 02, 12:52
Level Chart
Key Stats
Basic Info
| N/A | |
| Core Index Name | S&P 500 Pharmaceuticals, Biotechnology & Life Sciences (Industry Group) |
| Return Type | Price Return |
| Currency Code | USD |
| Category Hedge Type | Not Hedged |
Index Varieties
| Return Types | |
| Total Return | S&P 500 Pharmaceuticals, Biotechnology & Life Sciences (Industry Group) Total Return |
Total Return Performance
As of June 01, 2026.
Returns for periods of 1 year and above are annualized.
Annual Performance
As of June 02, 2026.
Basic Info
| N/A | |
| Core Index Name | S&P 500 Pharmaceuticals, Biotechnology & Life Sciences (Industry Group) |
| Return Type | Price Return |
| Currency Code | USD |
| Category Hedge Type | Not Hedged |
Index Varieties
| Return Types | |
| Total Return | S&P 500 Pharmaceuticals, Biotechnology & Life Sciences (Industry Group) Total Return |