

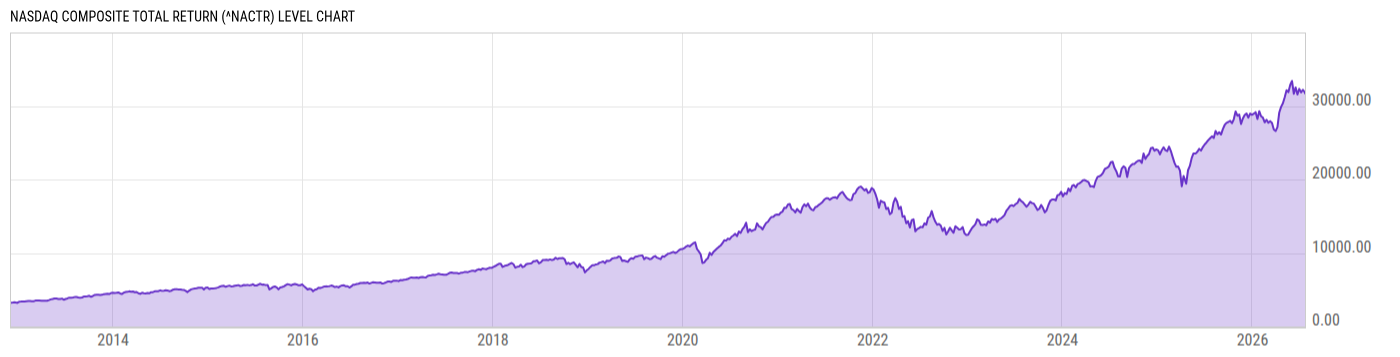
Nasdaq Composite Total Return (^NACTR)
31693.34
-180.42
(-0.57%)
USD |
Jul 22, 17:16
Level Chart
Key Stats
Basic Info
| The Nasdaq Composite is a stock market index that includes almost all stocks listed on the Nasdaq stock Exchange. The composition of the NASDAQ Composite is heavily weighted towards companies in the information technology sector. The Nasdaq Composite is a capitalization-weighted index; its price is calculated by taking the sum of the products of closing price and index share of all of the securities in the index. The sum is then divided by a divisor which reduces the order of magnitude of the result. | |
| Core Index Name | Nasdaq Composite |
| Return Type | Total Return |
| Currency Code | USD |
| Category Hedge Type | Not Hedged |
Index Varieties
| Return Types | |
| Net Total Return | Nasdaq Composite Net Total Return |
| Price Return | Nasdaq Composite |
| Currencies | |
| CAD | Nasdaq Composite Total Return CAD |
Total Return Performance
As of July 21, 2026.
Returns for periods of 1 year and above are annualized.
Annual Performance
As of July 22, 2026.
Basic Info
| The Nasdaq Composite is a stock market index that includes almost all stocks listed on the Nasdaq stock Exchange. The composition of the NASDAQ Composite is heavily weighted towards companies in the information technology sector. The Nasdaq Composite is a capitalization-weighted index; its price is calculated by taking the sum of the products of closing price and index share of all of the securities in the index. The sum is then divided by a divisor which reduces the order of magnitude of the result. | |
| Core Index Name | Nasdaq Composite |
| Return Type | Total Return |
| Currency Code | USD |
| Category Hedge Type | Not Hedged |
Index Varieties
| Return Types | |
| Net Total Return | Nasdaq Composite Net Total Return |
| Price Return | Nasdaq Composite |
| Currencies | |
| CAD | Nasdaq Composite Total Return CAD |