

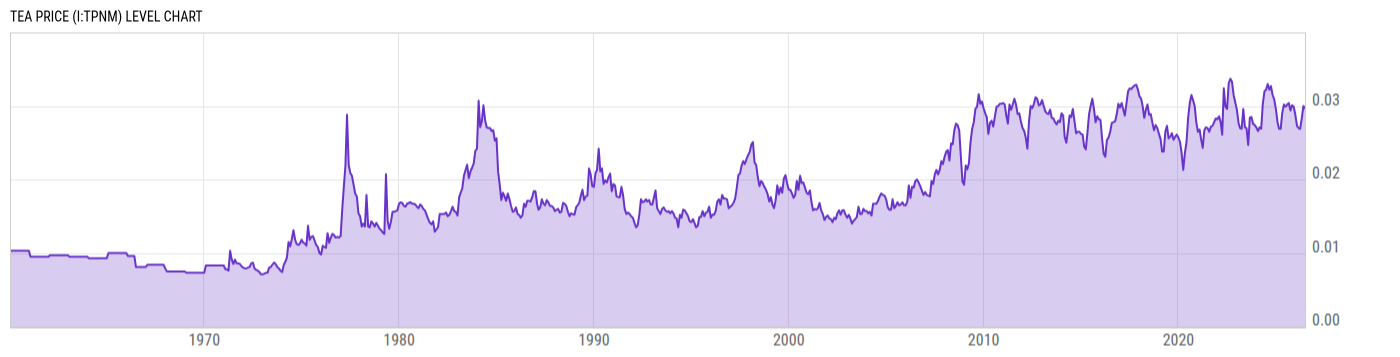
Tea Price (I:TPNM)
0.0297 USD/kg for Jun 2026
Level Chart
Basic Info
|
Tea Price is at a current level of 0.0297, down from 0.03 last month and down from 0.0299 one year ago. This is a change of -1.00% from last month and -0.67% from one year ago. |
| Report | Commodity Markets Review |
| Categories | Agriculture and Livestock , Chemicals , Metals |
| Region | N/A |
| Source | World Bank |
Stats
| Last Value | 0.0297 |
| Latest Period | Jun 2026 |
| Last Updated | Jul 6 2026, 10:00 EDT |
| Next Release | Aug 5 2026, 10:00 EDT (E) |
| Average Growth Rate | 3.79% |
| Value from Last Month | 0.03 |
| Change from Last Month | -1.00% |
| Value from 1 Year Ago | 0.0299 |
| Change from 1 Year Ago | -0.67% |
| Frequency | Monthly |
| Unit | USD per Kilogram |
| Adjustment | N/A |
| Download Source File | |
| Notes | Average of Colombo, Kolkata, Mombasa auctions. |
Historical Data
| Date | Value |
|---|---|
| June 30, 2026 | 0.0297 |
| May 31, 2026 | 0.03 |
| April 30, 2026 | 0.0283 |
| March 31, 2026 | 0.0269 |
| February 28, 2026 | 0.027 |
| January 31, 2026 | 0.0273 |
| December 31, 2025 | 0.0288 |
| November 30, 2025 | 0.0299 |
| October 31, 2025 | 0.0301 |
| September 30, 2025 | 0.0294 |
| August 31, 2025 | 0.0304 |
| July 31, 2025 | 0.0302 |
| June 30, 2025 | 0.0299 |
| May 31, 2025 | 0.0302 |
| April 30, 2025 | 0.0291 |
| March 31, 2025 | 0.0269 |
| February 28, 2025 | 0.0269 |
| January 31, 2025 | 0.0278 |
| December 31, 2024 | 0.0296 |
| November 30, 2024 | 0.0309 |
| October 31, 2024 | 0.0315 |
| September 30, 2024 | 0.0327 |
| August 31, 2024 | 0.0322 |
| July 31, 2024 | 0.033 |
| June 30, 2024 | 0.0322 |
| Date | Value |
|---|---|
| May 31, 2024 | 0.032 |
| April 30, 2024 | 0.0303 |
| March 31, 2024 | 0.0269 |
| February 29, 2024 | 0.0271 |
| January 31, 2024 | 0.0266 |
| December 31, 2023 | 0.0271 |
| November 30, 2023 | 0.0274 |
| October 31, 2023 | 0.0276 |
| September 30, 2023 | 0.0285 |
| August 31, 2023 | 0.0284 |
| July 31, 2023 | 0.0247 |
| June 30, 2023 | 0.027 |
| May 31, 2023 | 0.0271 |
| April 30, 2023 | 0.0296 |
| March 31, 2023 | 0.0269 |
| February 28, 2023 | 0.027 |
| January 31, 2023 | 0.0277 |
| December 31, 2022 | 0.0295 |
| November 30, 2022 | 0.0305 |
| October 31, 2022 | 0.0315 |
| September 30, 2022 | 0.0333 |
| August 31, 2022 | 0.0337 |
| July 31, 2022 | 0.0331 |
| June 30, 2022 | 0.0296 |
| May 31, 2022 | 0.0299 |
News
Headline
Time (ET)
07/15 06:12
07/14 08:48
07/14 07:51
Basic Info
|
Tea Price is at a current level of 0.0297, down from 0.03 last month and down from 0.0299 one year ago. This is a change of -1.00% from last month and -0.67% from one year ago. |
| Report | Commodity Markets Review |
| Categories | Agriculture and Livestock , Chemicals , Metals |
| Region | N/A |
| Source | World Bank |
Stats
| Last Value | 0.0297 |
| Latest Period | Jun 2026 |
| Last Updated | Jul 6 2026, 10:00 EDT |
| Next Release | Aug 5 2026, 10:00 EDT (E) |
| Average Growth Rate | 3.79% |
| Value from Last Month | 0.03 |
| Change from Last Month | -1.00% |
| Value from 1 Year Ago | 0.0299 |
| Change from 1 Year Ago | -0.67% |
| Frequency | Monthly |
| Unit | USD per Kilogram |
| Adjustment | N/A |
| Download Source File | |
| Notes | Average of Colombo, Kolkata, Mombasa auctions. |