

Wichita Falls, TX Labor Force (I:WFTXLFUM)
66216.00 for Mar 2026
Level Chart
Basic Info
|
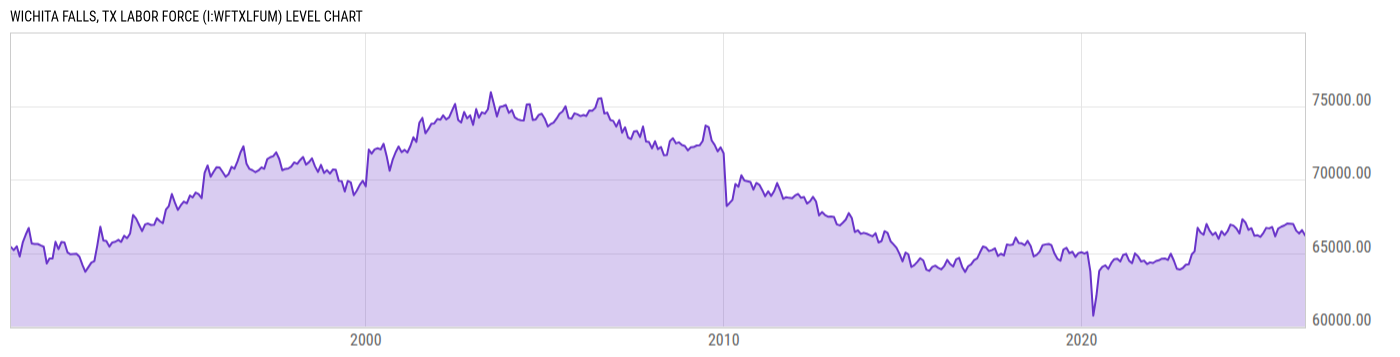
Wichita Falls, TX Labor Force is at a current level of 66216.00, down from 66558.00 last month and down from 66675.00 one year ago. This is a change of -0.51% from last month and -0.69% from one year ago. |
| Report | Metropolitan Area Employment and Unemployment |
| Categories | Employment , Hours and Wages |
| Region | N/A |
| Source | Bureau of Labor Statistics |
Stats
| Last Value | 66216.00 |
| Latest Period | Mar 2026 |
| Last Updated | May 22 2026, 19:25 EDT |
| Next Release | Jun 3 2026, 10:30 EDT |
| Average Growth Rate | 0.07% |
| Value from Last Month | 66558.00 |
| Change from Last Month | -0.51% |
| Value from 1 Year Ago | 66675.00 |
| Change from 1 Year Ago | -0.69% |
| Frequency | Monthly |
| Adjustment | Not Seasonally Adjusted |
| Download Source File | |
| Notes | Metropolitan Statistical Area. |
Historical Data
| Date | Value |
|---|---|
| March 31, 2026 | 66216.00 |
| February 28, 2026 | 66558.00 |
| January 31, 2026 | 66328.00 |
| December 31, 2025 | 66523.00 |
| November 30, 2025 | 66980.00 |
| October 31, 2025 | |
| September 30, 2025 | 67000.00 |
| August 31, 2025 | 66869.00 |
| July 31, 2025 | 66787.00 |
| June 30, 2025 | 66661.00 |
| May 31, 2025 | 66132.00 |
| April 30, 2025 | 66767.00 |
| March 31, 2025 | 66675.00 |
| February 28, 2025 | 66710.00 |
| January 31, 2025 | 66372.00 |
| December 31, 2024 | 66098.00 |
| November 30, 2024 | 66209.00 |
| October 31, 2024 | 66171.00 |
| September 30, 2024 | 66686.00 |
| August 31, 2024 | 66573.00 |
| July 31, 2024 | 67078.00 |
| June 30, 2024 | 67299.00 |
| May 31, 2024 | 66327.00 |
| April 30, 2024 | 66663.00 |
| March 31, 2024 | 66862.00 |
| Date | Value |
|---|---|
| February 29, 2024 | 66933.00 |
| January 31, 2024 | 66480.00 |
| December 31, 2023 | 66221.00 |
| November 30, 2023 | 66484.00 |
| October 31, 2023 | 65959.00 |
| September 30, 2023 | 66387.00 |
| August 31, 2023 | 66229.00 |
| July 31, 2023 | 66520.00 |
| June 30, 2023 | 66975.00 |
| May 31, 2023 | 66246.00 |
| April 30, 2023 | 66398.00 |
| March 31, 2023 | 66715.00 |
| February 28, 2023 | 65110.00 |
| January 31, 2023 | 64917.00 |
| December 31, 2022 | 64237.00 |
| November 30, 2022 | 64198.00 |
| October 31, 2022 | 63980.00 |
| September 30, 2022 | 63875.00 |
| August 31, 2022 | 63929.00 |
| July 31, 2022 | 64491.00 |
| June 30, 2022 | 64951.00 |
| May 31, 2022 | 64527.00 |
| April 30, 2022 | 64634.00 |
| March 31, 2022 | 64617.00 |
| February 28, 2022 | 64506.00 |
News
Headline
Time (ET)
05/29 08:15
Basic Info
|
Wichita Falls, TX Labor Force is at a current level of 66216.00, down from 66558.00 last month and down from 66675.00 one year ago. This is a change of -0.51% from last month and -0.69% from one year ago. |
| Report | Metropolitan Area Employment and Unemployment |
| Categories | Employment , Hours and Wages |
| Region | N/A |
| Source | Bureau of Labor Statistics |
Stats
| Last Value | 66216.00 |
| Latest Period | Mar 2026 |
| Last Updated | May 22 2026, 19:25 EDT |
| Next Release | Jun 3 2026, 10:30 EDT |
| Average Growth Rate | 0.07% |
| Value from Last Month | 66558.00 |
| Change from Last Month | -0.51% |
| Value from 1 Year Ago | 66675.00 |
| Change from 1 Year Ago | -0.69% |
| Frequency | Monthly |
| Adjustment | Not Seasonally Adjusted |
| Download Source File | |
| Notes | Metropolitan Statistical Area. |