

US U-6 Unemployment Rate (I:USU6URSA)
8.20% for Apr 2026
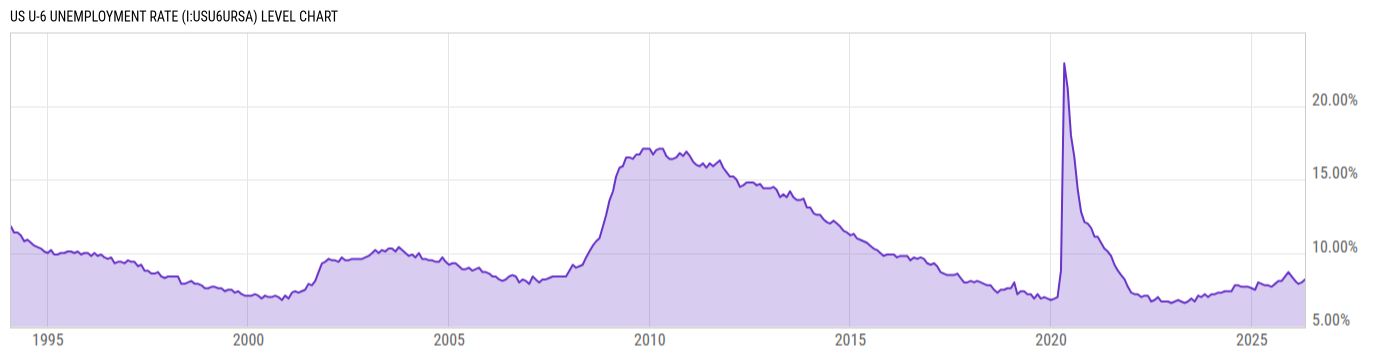
Level Chart
Basic Info
|
US U-6 Unemployment Rate is at 8.20%, compared to 8.00% last month and 7.80% last year. This is lower than the long term average of 10.00%. |
| Report | Employment Situation |
| Categories | Employment , Hours and Wages |
| Region | United States |
| Source | Bureau of Labor Statistics |
Stats
| Last Value | 8.20% |
| Latest Period | Apr 2026 |
| Last Updated | May 8 2026, 11:36 EDT |
| Next Release | Jun 5 2026, 08:30 EDT |
| Long Term Average | 10.00% |
| Average Growth Rate | 1.21% |
| Value from Last Month | 8.00% |
| Change from Last Month | 2.50% |
| Value from 1 Year Ago | 7.80% |
| Change from 1 Year Ago | 5.13% |
| Frequency | Monthly |
| Unit | Percent of Labor Force Plus Marginally Attached |
| Adjustment | Seasonally Adjusted |
| Download Source File | |
| Notes | U-6 Unemployment is all unemployed, marginally attached and part-time for economic reasons individuals as a percent of the civillian labor force plus all marginally attached workers. |
Historical Data
| Date | Value |
|---|---|
| April 30, 2026 | 8.20% |
| March 31, 2026 | 8.00% |
| February 28, 2026 | 7.90% |
| January 31, 2026 | 8.10% |
| December 31, 2025 | 8.40% |
| November 30, 2025 | 8.70% |
| October 31, 2025 | |
| September 30, 2025 | 8.10% |
| August 31, 2025 | 8.10% |
| July 31, 2025 | 7.90% |
| June 30, 2025 | 7.70% |
| May 31, 2025 | 7.80% |
| April 30, 2025 | 7.80% |
| March 31, 2025 | 7.90% |
| February 28, 2025 | 8.00% |
| January 31, 2025 | 7.50% |
| December 31, 2024 | 7.60% |
| November 30, 2024 | 7.70% |
| October 31, 2024 | 7.70% |
| September 30, 2024 | 7.70% |
| August 31, 2024 | 7.80% |
| July 31, 2024 | 7.80% |
| June 30, 2024 | 7.40% |
| May 31, 2024 | 7.40% |
| April 30, 2024 | 7.40% |
| Date | Value |
|---|---|
| March 31, 2024 | 7.30% |
| February 29, 2024 | 7.30% |
| January 31, 2024 | 7.20% |
| December 31, 2023 | 7.20% |
| November 30, 2023 | 7.00% |
| October 31, 2023 | 7.20% |
| September 30, 2023 | 7.00% |
| August 31, 2023 | 7.10% |
| July 31, 2023 | 6.70% |
| June 30, 2023 | 6.90% |
| May 31, 2023 | 6.70% |
| April 30, 2023 | 6.60% |
| March 31, 2023 | 6.70% |
| February 28, 2023 | 6.80% |
| January 31, 2023 | 6.70% |
| December 31, 2022 | 6.60% |
| November 30, 2022 | 6.70% |
| October 31, 2022 | 6.70% |
| September 30, 2022 | 6.70% |
| August 31, 2022 | 7.00% |
| July 31, 2022 | 6.80% |
| June 30, 2022 | 6.70% |
| May 31, 2022 | 7.10% |
| April 30, 2022 | 7.10% |
| March 31, 2022 | 7.00% |
News
Headline
Time (ET)
05/08 07:44
Basic Info
|
US U-6 Unemployment Rate is at 8.20%, compared to 8.00% last month and 7.80% last year. This is lower than the long term average of 10.00%. |
| Report | Employment Situation |
| Categories | Employment , Hours and Wages |
| Region | United States |
| Source | Bureau of Labor Statistics |
Stats
| Last Value | 8.20% |
| Latest Period | Apr 2026 |
| Last Updated | May 8 2026, 11:36 EDT |
| Next Release | Jun 5 2026, 08:30 EDT |
| Long Term Average | 10.00% |
| Average Growth Rate | 1.21% |
| Value from Last Month | 8.00% |
| Change from Last Month | 2.50% |
| Value from 1 Year Ago | 7.80% |
| Change from 1 Year Ago | 5.13% |
| Frequency | Monthly |
| Unit | Percent of Labor Force Plus Marginally Attached |
| Adjustment | Seasonally Adjusted |
| Download Source File | |
| Notes | U-6 Unemployment is all unemployed, marginally attached and part-time for economic reasons individuals as a percent of the civillian labor force plus all marginally attached workers. |