

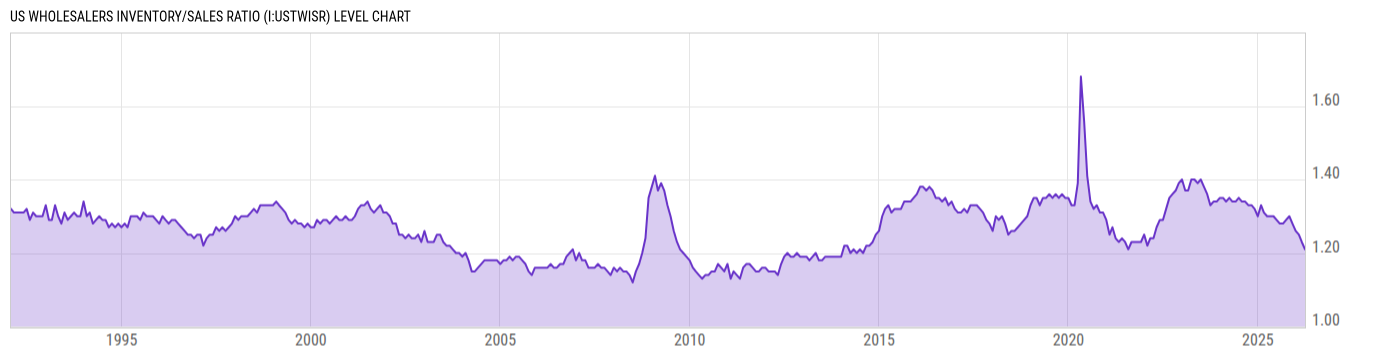
US Wholesalers Inventory/Sales Ratio (I:USTWISR)
1.21 for Mar 2026
Level Chart
Basic Info
|
US Wholesalers Inventory/Sales Ratio is at a current level of 1.21, down from 1.23 last month and down from 1.30 one year ago. This is a change of -1.63% from last month and -6.92% from one year ago. |
| Region | United States |
| Source | Census Bureau |
Stats
| Last Value | 1.21 |
| Latest Period | Mar 2026 |
| Last Updated | May 14 2026, 10:04 EDT |
| Next Release | Jun 17 2026, 10:00 EDT |
| Average Growth Rate | -0.07% |
| Value from Last Month | 1.23 |
| Change from Last Month | -1.63% |
| Value from 1 Year Ago | 1.30 |
| Change from 1 Year Ago | -6.92% |
| Frequency | Monthly |
| Adjustment | Seasonally Adjusted |
Historical Data
| Date | Value |
|---|---|
| March 31, 2026 | 1.21 |
| February 28, 2026 | 1.23 |
| January 31, 2026 | 1.25 |
| December 31, 2025 | 1.26 |
| November 30, 2025 | 1.28 |
| October 31, 2025 | 1.30 |
| September 30, 2025 | 1.29 |
| August 31, 2025 | 1.28 |
| July 31, 2025 | 1.28 |
| June 30, 2025 | 1.29 |
| May 31, 2025 | 1.30 |
| April 30, 2025 | 1.30 |
| March 31, 2025 | 1.30 |
| February 28, 2025 | 1.31 |
| January 31, 2025 | 1.33 |
| December 31, 2024 | 1.30 |
| November 30, 2024 | 1.32 |
| October 31, 2024 | 1.33 |
| September 30, 2024 | 1.33 |
| August 31, 2024 | 1.34 |
| July 31, 2024 | 1.34 |
| June 30, 2024 | 1.35 |
| May 31, 2024 | 1.34 |
| April 30, 2024 | 1.34 |
| March 31, 2024 | 1.35 |
| Date | Value |
|---|---|
| February 29, 2024 | 1.34 |
| January 31, 2024 | 1.35 |
| December 31, 2023 | 1.35 |
| November 30, 2023 | 1.34 |
| October 31, 2023 | 1.34 |
| September 30, 2023 | 1.33 |
| August 31, 2023 | 1.36 |
| July 31, 2023 | 1.38 |
| June 30, 2023 | 1.40 |
| May 31, 2023 | 1.39 |
| April 30, 2023 | 1.40 |
| March 31, 2023 | 1.40 |
| February 28, 2023 | 1.37 |
| January 31, 2023 | 1.37 |
| December 31, 2022 | 1.40 |
| November 30, 2022 | 1.39 |
| October 31, 2022 | 1.37 |
| September 30, 2022 | 1.36 |
| August 31, 2022 | 1.35 |
| July 31, 2022 | 1.32 |
| June 30, 2022 | 1.29 |
| May 31, 2022 | 1.29 |
| April 30, 2022 | 1.27 |
| March 31, 2022 | 1.24 |
| February 28, 2022 | 1.24 |
News
Headline
Time (ET)
05/14 07:39
Basic Info
|
US Wholesalers Inventory/Sales Ratio is at a current level of 1.21, down from 1.23 last month and down from 1.30 one year ago. This is a change of -1.63% from last month and -6.92% from one year ago. |
| Region | United States |
| Source | Census Bureau |
Stats
| Last Value | 1.21 |
| Latest Period | Mar 2026 |
| Last Updated | May 14 2026, 10:04 EDT |
| Next Release | Jun 17 2026, 10:00 EDT |
| Average Growth Rate | -0.07% |
| Value from Last Month | 1.23 |
| Change from Last Month | -1.63% |
| Value from 1 Year Ago | 1.30 |
| Change from 1 Year Ago | -6.92% |
| Frequency | Monthly |
| Adjustment | Seasonally Adjusted |