

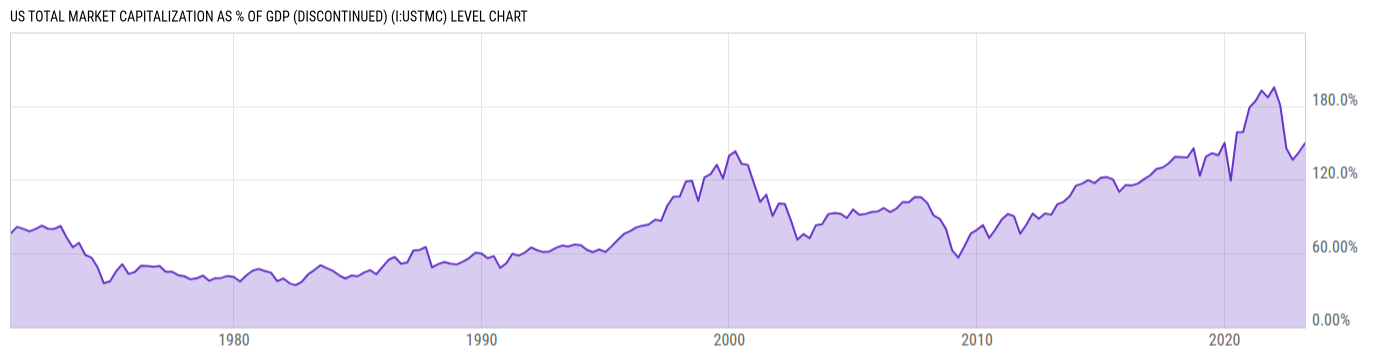
US Total Market Capitalization as % of GDP (DISCONTINUED) (I:USTMC)
149.6% of GDP for Mar 31 2023
Level Chart
Basic Info
|
US Total Market Capitalization as % of GDP (DISCONTINUED) is at 149.6%, compared to 142.2% the previous market day and 180.6% last year. This is higher than the long term average of 83.13%. |
| Report | Wilshire Indexes |
| Category | Market Indices and Statistics |
| Region | United States |
| Source | Wilshire |
Stats
| Last Value | 149.6% |
| Latest Period | Mar 31 2023 |
| Last Updated | Jun 25 2026, 08:33 EDT |
| Long Term Average | 83.13% |
| Average Growth Rate | 178.4% |
| Value from The Previous Market Day | 142.2% |
| Change from The Previous Market Day | 5.17% |
| Value from 1 Year Ago | 180.6% |
| Change from 1 Year Ago | -17.19% |
| Frequency | Market Daily |
| Unit | Percent of GDP |
| Adjustment | N/A |
| Formula | Wilshire 5000 Price Full Cap Index (DISCONTINUED) * 100.00 / US GDP * 0.00 |
Historical Data
| Date | Value |
|---|---|
| March 31, 2023 | 149.6% |
| December 31, 2022 | 142.2% |
| September 30, 2022 | 136.1% |
| June 30, 2022 | 145.3% |
| March 31, 2022 | 180.6% |
| December 31, 2021 | 195.3% |
| September 30, 2021 | 187.0% |
| June 30, 2021 | 192.6% |
| March 31, 2021 | 184.0% |
| December 31, 2020 | 178.6% |
| September 30, 2020 | 158.9% |
| June 30, 2020 | 158.5% |
| March 31, 2020 | 119.1% |
| December 31, 2019 | 149.9% |
| September 30, 2019 | 139.8% |
| June 30, 2019 | 141.5% |
| March 31, 2019 | 138.6% |
| December 31, 2018 | 123.1% |
| September 30, 2018 | 145.5% |
| June 30, 2018 | 138.0% |
| December 31, 2017 | 138.6% |
| September 30, 2017 | 133.2% |
| June 30, 2017 | 129.8% |
| March 31, 2017 | 128.6% |
| December 31, 2016 | 123.5% |
| Date | Value |
|---|---|
| September 30, 2016 | 120.3% |
| June 30, 2016 | 116.7% |
| March 31, 2016 | 115.2% |
| December 31, 2015 | 115.5% |
| September 30, 2015 | 109.9% |
| June 30, 2015 | 120.1% |
| March 31, 2015 | 122.0% |
| December 31, 2014 | 121.4% |
| September 30, 2014 | 117.0% |
| June 30, 2014 | 119.5% |
| March 31, 2014 | 116.6% |
| December 31, 2013 | 115.0% |
| September 30, 2013 | 106.3% |
| June 30, 2013 | 101.8% |
| March 31, 2013 | 99.81% |
| December 31, 2012 | 91.32% |
| September 30, 2012 | 92.19% |
| June 30, 2012 | 87.98% |
| March 31, 2012 | 92.14% |
| December 31, 2011 | 83.26% |
| September 30, 2011 | 75.68% |
| June 30, 2011 | 90.14% |
| March 31, 2011 | 91.86% |
| December 31, 2010 | 87.27% |
| September 30, 2010 | 79.39% |
News
Headline
Time (ET)
07/09 13:22
06/24 11:32
Basic Info
|
US Total Market Capitalization as % of GDP (DISCONTINUED) is at 149.6%, compared to 142.2% the previous market day and 180.6% last year. This is higher than the long term average of 83.13%. |
| Report | Wilshire Indexes |
| Category | Market Indices and Statistics |
| Region | United States |
| Source | Wilshire |
Stats
| Last Value | 149.6% |
| Latest Period | Mar 31 2023 |
| Last Updated | Jun 25 2026, 08:33 EDT |
| Long Term Average | 83.13% |
| Average Growth Rate | 178.4% |
| Value from The Previous Market Day | 142.2% |
| Change from The Previous Market Day | 5.17% |
| Value from 1 Year Ago | 180.6% |
| Change from 1 Year Ago | -17.19% |
| Frequency | Market Daily |
| Unit | Percent of GDP |
| Adjustment | N/A |
| Formula | Wilshire 5000 Price Full Cap Index (DISCONTINUED) * 100.00 / US GDP * 0.00 |