

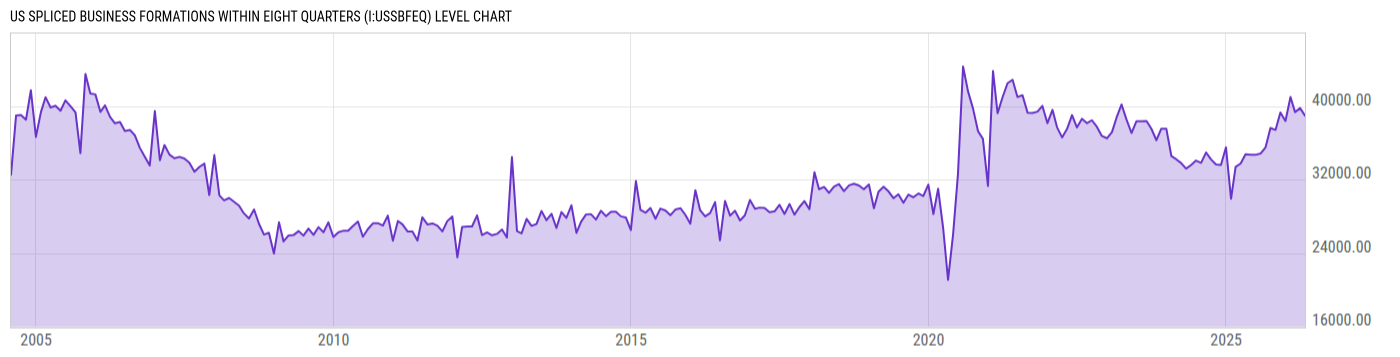
US Spliced Business Formations within Eight Quarters (I:USSBFEQ)
38954.00 for Apr 2026
Level Chart
Basic Info
|
US Spliced Business Formations within Eight Quarters is at a current level of 38954.00, down from 39768.00 last month and up from 34742.00 one year ago. This is a change of -2.05% from last month and 12.12% from one year ago. |
| Region | United States |
| Source | Census Bureau |
Stats
| Last Value | 38954.00 |
| Latest Period | Apr 2026 |
| Last Updated | May 13 2026, 10:04 EDT |
| Next Release | Jun 10 2026, 10:00 EDT |
| Average Growth Rate | 3.91% |
| Value from Last Month | 39768.00 |
| Change from Last Month | -2.05% |
| Value from 1 Year Ago | 34742.00 |
| Change from 1 Year Ago | 12.12% |
| Frequency | Monthly |
| Adjustment | Seasonally Adjusted |
Historical Data
| Date | Value |
|---|---|
| April 30, 2026 | 38954.00 |
| March 31, 2026 | 39768.00 |
| February 28, 2026 | 39331.00 |
| January 31, 2026 | 40972.00 |
| December 31, 2025 | 38366.00 |
| November 30, 2025 | 39288.00 |
| October 31, 2025 | 37397.00 |
| September 30, 2025 | 37604.00 |
| August 31, 2025 | 35507.00 |
| July 31, 2025 | 34829.00 |
| June 30, 2025 | 34683.00 |
| May 31, 2025 | 34696.00 |
| April 30, 2025 | 34742.00 |
| March 31, 2025 | 33742.00 |
| February 28, 2025 | 33370.00 |
| January 31, 2025 | 29902.00 |
| December 31, 2024 | 35500.00 |
| November 30, 2024 | 33572.00 |
| October 31, 2024 | 33628.00 |
| September 30, 2024 | 34194.00 |
| August 31, 2024 | 34942.00 |
| July 31, 2024 | 33816.00 |
| June 30, 2024 | 34060.00 |
| May 31, 2024 | 33575.00 |
| April 30, 2024 | 33189.00 |
| Date | Value |
|---|---|
| March 31, 2024 | 33787.00 |
| February 29, 2024 | 34208.00 |
| January 31, 2024 | 34534.00 |
| December 31, 2023 | 37512.00 |
| November 30, 2023 | 37527.00 |
| October 31, 2023 | 36275.00 |
| September 30, 2023 | 37523.00 |
| August 31, 2023 | 38365.00 |
| July 31, 2023 | 38348.00 |
| June 30, 2023 | 38338.00 |
| May 31, 2023 | 37059.00 |
| April 30, 2023 | 38542.00 |
| March 31, 2023 | 40167.00 |
| February 28, 2023 | 38727.00 |
| January 31, 2023 | 37159.00 |
| December 31, 2022 | 36487.00 |
| November 30, 2022 | 36742.00 |
| October 31, 2022 | 37721.00 |
| September 30, 2022 | 38450.00 |
| August 31, 2022 | 38132.00 |
| July 31, 2022 | 38602.00 |
| June 30, 2022 | 37669.00 |
| May 31, 2022 | 39007.00 |
| April 30, 2022 | 37492.00 |
| March 31, 2022 | 36582.00 |
News
Headline
Time (ET)
05/21 07:19
04/23 08:36
Basic Info
|
US Spliced Business Formations within Eight Quarters is at a current level of 38954.00, down from 39768.00 last month and up from 34742.00 one year ago. This is a change of -2.05% from last month and 12.12% from one year ago. |
| Region | United States |
| Source | Census Bureau |
Stats
| Last Value | 38954.00 |
| Latest Period | Apr 2026 |
| Last Updated | May 13 2026, 10:04 EDT |
| Next Release | Jun 10 2026, 10:00 EDT |
| Average Growth Rate | 3.91% |
| Value from Last Month | 39768.00 |
| Change from Last Month | -2.05% |
| Value from 1 Year Ago | 34742.00 |
| Change from 1 Year Ago | 12.12% |
| Frequency | Monthly |
| Adjustment | Seasonally Adjusted |