

US Real Retail Sales (I:USRRS)
200.28B USD for Jun 2026
Level Chart
Basic Info
|
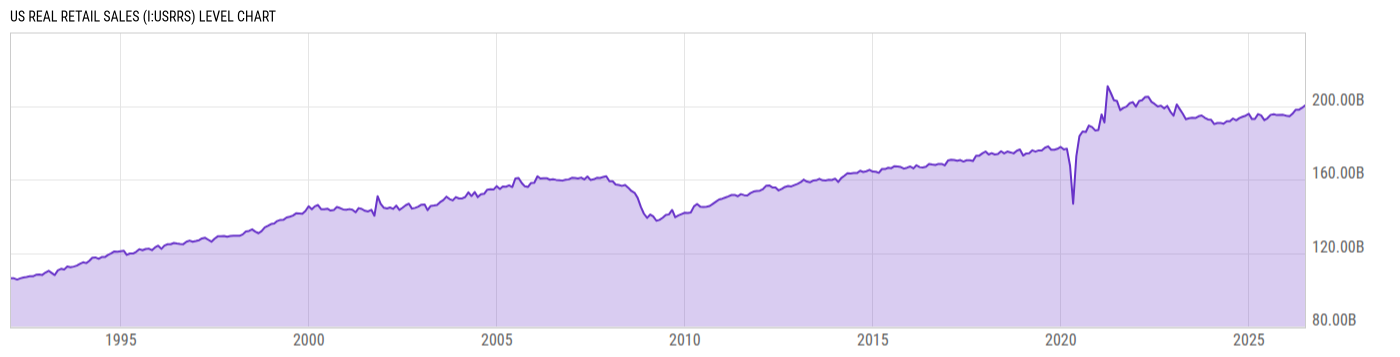
US Real Retail Sales is at a current level of 200.28B, up from 198.95B last month and up from 193.31B one year ago. This is a change of 0.67% from last month and 3.60% from one year ago. |
| Region | United States |
| Source | Census Bureau |
Stats
| Last Value | 200.28B |
| Latest Period | Jun 2026 |
| Last Updated | Jul 16 2026, 08:32 EDT |
| Average Growth Rate | 1.99% |
| Value from Last Month | 198.95B |
| Change from Last Month | 0.67% |
| Value from 1 Year Ago | 193.31B |
| Change from 1 Year Ago | 3.60% |
| Frequency | Monthly |
| Unit | USD |
| Adjustment | Seasonally Adjusted |
| Notes | US Retail Sales divided by US Consumer Price Index. |
| Formula | US Retail Sales * 100.00 / US Consumer Price Index |
Historical Data
| Date | Value |
|---|---|
| June 30, 2026 | 200.28B |
| May 31, 2026 | 198.95B |
| April 30, 2026 | 197.90B |
| March 31, 2026 | 197.94B |
| February 28, 2026 | 195.76B |
| January 31, 2026 | 194.42B |
| December 31, 2025 | 194.71B |
| November 30, 2025 | 195.19B |
| September 30, 2025 | 195.04B |
| August 31, 2025 | 195.54B |
| July 31, 2025 | 195.16B |
| June 30, 2025 | 193.31B |
| May 31, 2025 | 192.30B |
| April 30, 2025 | 194.90B |
| March 31, 2025 | 195.58B |
| February 28, 2025 | 192.89B |
| January 31, 2025 | 192.86B |
| December 31, 2024 | 195.75B |
| November 30, 2024 | 194.72B |
| October 31, 2024 | 194.14B |
| September 30, 2024 | 193.43B |
| August 31, 2024 | 192.19B |
| July 31, 2024 | 193.20B |
| June 30, 2024 | 191.66B |
| May 31, 2024 | 191.70B |
| Date | Value |
|---|---|
| April 30, 2024 | 190.30B |
| March 31, 2024 | 190.80B |
| February 29, 2024 | 190.76B |
| January 31, 2024 | 190.17B |
| December 31, 2023 | 192.48B |
| November 30, 2023 | 192.66B |
| October 31, 2023 | 193.57B |
| September 30, 2023 | 194.86B |
| August 31, 2023 | 194.42B |
| July 31, 2023 | 193.44B |
| June 30, 2023 | 193.58B |
| May 31, 2023 | 193.29B |
| April 30, 2023 | 192.79B |
| March 31, 2023 | 195.80B |
| February 28, 2023 | 198.45B |
| January 31, 2023 | 200.86B |
| December 31, 2022 | 194.69B |
| November 30, 2022 | 196.99B |
| October 31, 2022 | 200.04B |
| September 30, 2022 | 198.72B |
| August 31, 2022 | 200.19B |
| July 31, 2022 | 199.69B |
| June 30, 2022 | 201.14B |
| May 31, 2022 | 202.25B |
| April 30, 2022 | 205.06B |
News
Headline
Time (ET)
07/20 12:48
07/07 12:22
07/07 10:33
Basic Info
|
US Real Retail Sales is at a current level of 200.28B, up from 198.95B last month and up from 193.31B one year ago. This is a change of 0.67% from last month and 3.60% from one year ago. |
| Region | United States |
| Source | Census Bureau |
Stats
| Last Value | 200.28B |
| Latest Period | Jun 2026 |
| Last Updated | Jul 16 2026, 08:32 EDT |
| Average Growth Rate | 1.99% |
| Value from Last Month | 198.95B |
| Change from Last Month | 0.67% |
| Value from 1 Year Ago | 193.31B |
| Change from 1 Year Ago | 3.60% |
| Frequency | Monthly |
| Unit | USD |
| Adjustment | Seasonally Adjusted |
| Notes | US Retail Sales divided by US Consumer Price Index. |
| Formula | US Retail Sales * 100.00 / US Consumer Price Index |