

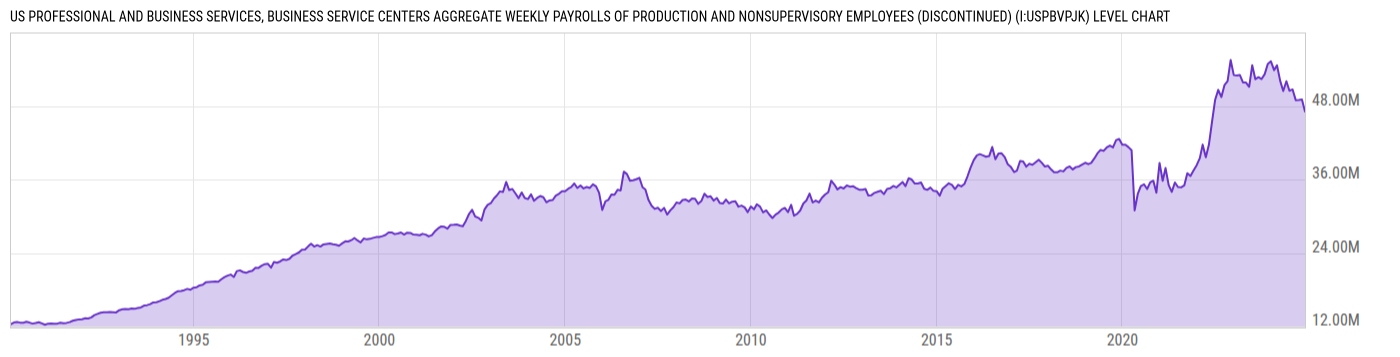
US Professional and Business Services, Business Service Centers Aggregate Weekly Payrolls of Production and Nonsupervisory Employees (DISCONTINUED) (I:USPBVPJK)
47.08M for Nov 2024
Level Chart
Basic Info
|
US Professional and Business Services, Business Service Centers Aggregate Weekly Payrolls of Production and Nonsupervisory Employees is at a current level of 47.08M, down from 49.06M last month and down from 54.86M one year ago. This is a change of -4.02% from last month and -14.17% from one year ago. |
| Report | Employment Situation |
| Categories | Employment , Hours and Wages |
| Region | United States |
| Source | Bureau of Labor Statistics |
Stats
| Last Value | 47.08M |
| Latest Period | Nov 2024 |
| Last Updated | Jan 10 2025, 10:41 EST |
| Average Growth Rate | 4.26% |
| Value from Last Month | 49.06M |
| Change from Last Month | -4.02% |
| Value from 1 Year Ago | 54.86M |
| Change from 1 Year Ago | -14.17% |
| Frequency | Monthly |
| Adjustment | Seasonally Adjusted |
| Download Source File |
Historical Data
| Date | Value |
|---|---|
| November 30, 2024 | 47.08M |
| October 31, 2024 | 49.06M |
| September 30, 2024 | 48.97M |
| August 31, 2024 | 48.96M |
| July 31, 2024 | 50.70M |
| June 30, 2024 | 50.50M |
| May 31, 2024 | 52.04M |
| April 30, 2024 | 50.45M |
| March 31, 2024 | 52.11M |
| February 29, 2024 | 54.63M |
| January 31, 2024 | 53.86M |
| December 31, 2023 | 55.30M |
| November 30, 2023 | 54.86M |
| October 31, 2023 | 53.20M |
| September 30, 2023 | 52.40M |
| August 31, 2023 | 52.70M |
| July 31, 2023 | 52.38M |
| June 30, 2023 | 54.65M |
| May 31, 2023 | 51.14M |
| April 30, 2023 | 51.82M |
| March 31, 2023 | 51.84M |
| February 28, 2023 | 53.06M |
| January 31, 2023 | 52.97M |
| December 31, 2022 | 53.04M |
| November 30, 2022 | 55.50M |
| Date | Value |
|---|---|
| October 31, 2022 | 52.05M |
| September 30, 2022 | 51.40M |
| August 31, 2022 | 49.46M |
| July 31, 2022 | 50.64M |
| June 30, 2022 | 48.97M |
| May 31, 2022 | 45.43M |
| April 30, 2022 | 41.66M |
| March 31, 2022 | 39.62M |
| February 28, 2022 | 41.69M |
| January 31, 2022 | 39.50M |
| December 31, 2021 | 38.34M |
| November 30, 2021 | 37.47M |
| October 31, 2021 | 36.56M |
| September 30, 2021 | 37.04M |
| August 31, 2021 | 35.03M |
| July 31, 2021 | 34.71M |
| June 30, 2021 | 34.78M |
| May 31, 2021 | 35.52M |
| April 30, 2021 | 33.97M |
| March 31, 2021 | 35.08M |
| February 28, 2021 | 37.87M |
| January 31, 2021 | 35.79M |
| December 31, 2020 | 38.71M |
| November 30, 2020 | 33.84M |
| October 31, 2020 | 35.81M |
News
Headline
Time (ET)
05/08 07:44
Basic Info
|
US Professional and Business Services, Business Service Centers Aggregate Weekly Payrolls of Production and Nonsupervisory Employees is at a current level of 47.08M, down from 49.06M last month and down from 54.86M one year ago. This is a change of -4.02% from last month and -14.17% from one year ago. |
| Report | Employment Situation |
| Categories | Employment , Hours and Wages |
| Region | United States |
| Source | Bureau of Labor Statistics |
Stats
| Last Value | 47.08M |
| Latest Period | Nov 2024 |
| Last Updated | Jan 10 2025, 10:41 EST |
| Average Growth Rate | 4.26% |
| Value from Last Month | 49.06M |
| Change from Last Month | -4.02% |
| Value from 1 Year Ago | 54.86M |
| Change from 1 Year Ago | -14.17% |
| Frequency | Monthly |
| Adjustment | Seasonally Adjusted |
| Download Source File |