

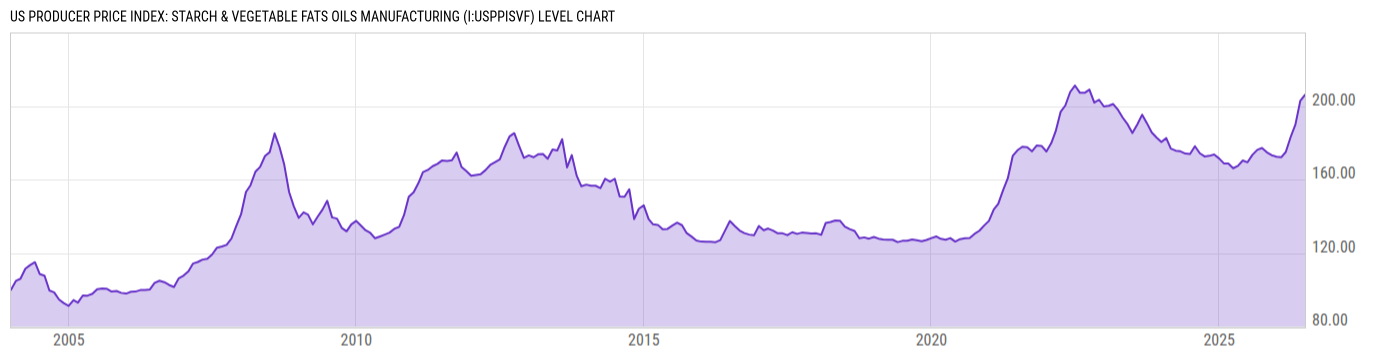
US Producer Price Index: Starch & Vegetable Fats Oils Manufacturing (I:USPPISVF)
206.12 for Jun 2026
Level Chart
Basic Info
|
US Producer Price Index: Starch & Vegetable Fats Oils Manufacturing is at a current level of 206.12, up from 202.80 last month and up from 169.35 one year ago. This is a change of 1.64% from last month and 21.71% from one year ago. |
| Report | Producer Price Index |
| Category | Producer Prices |
| Region | United States |
| Source | Bureau of Labor Statistics |
Stats
| Last Value | 206.12 |
| Latest Period | Jun 2026 |
| Last Updated | Jul 15 2026, 08:38 EDT |
| Next Release | Aug 13 2026, 08:30 EDT |
| Average Growth Rate | 3.65% |
| Value from Last Month | 202.80 |
| Change from Last Month | 1.64% |
| Value from 1 Year Ago | 169.35 |
| Change from 1 Year Ago | 21.71% |
| Frequency | Monthly |
| Unit | Index December 2003=100 |
| Adjustment | Not Seasonally Adjusted |
| Download Source File |
Historical Data
| Date | Value |
|---|---|
| June 30, 2026 | 206.12 |
| May 31, 2026 | 202.80 |
| April 30, 2026 | 189.88 |
| March 31, 2026 | 183.12 |
| February 28, 2026 | 174.96 |
| January 31, 2026 | 172.13 |
| December 31, 2025 | 172.41 |
| November 30, 2025 | 173.22 |
| October 31, 2025 | 174.78 |
| September 30, 2025 | 177.12 |
| August 31, 2025 | 176.13 |
| July 31, 2025 | 173.39 |
| June 30, 2025 | 169.35 |
| May 31, 2025 | 170.35 |
| April 30, 2025 | 167.38 |
| March 31, 2025 | 166.13 |
| February 28, 2025 | 168.66 |
| January 31, 2025 | 168.76 |
| December 31, 2024 | 171.51 |
| November 30, 2024 | 173.63 |
| October 31, 2024 | 172.86 |
| September 30, 2024 | 172.58 |
| August 31, 2024 | 174.28 |
| July 31, 2024 | 178.12 |
| June 30, 2024 | 173.86 |
| Date | Value |
|---|---|
| May 31, 2024 | 174.10 |
| April 30, 2024 | 175.35 |
| March 31, 2024 | 175.69 |
| February 29, 2024 | 176.84 |
| January 31, 2024 | 182.52 |
| December 31, 2023 | 180.42 |
| November 30, 2023 | 182.85 |
| October 31, 2023 | 185.60 |
| September 30, 2023 | 190.67 |
| August 31, 2023 | 195.28 |
| July 31, 2023 | 189.90 |
| June 30, 2023 | 185.28 |
| May 31, 2023 | 189.96 |
| April 30, 2023 | 193.61 |
| March 31, 2023 | 197.86 |
| February 28, 2023 | 201.06 |
| January 31, 2023 | 200.14 |
| December 31, 2022 | 199.72 |
| November 30, 2022 | 203.40 |
| October 31, 2022 | 201.82 |
| September 30, 2022 | 208.89 |
| August 31, 2022 | 207.18 |
| July 31, 2022 | 207.25 |
| June 30, 2022 | 211.12 |
| May 31, 2022 | 207.61 |
News
Headline
Time (ET)
06/23 12:02
Basic Info
|
US Producer Price Index: Starch & Vegetable Fats Oils Manufacturing is at a current level of 206.12, up from 202.80 last month and up from 169.35 one year ago. This is a change of 1.64% from last month and 21.71% from one year ago. |
| Report | Producer Price Index |
| Category | Producer Prices |
| Region | United States |
| Source | Bureau of Labor Statistics |
Stats
| Last Value | 206.12 |
| Latest Period | Jun 2026 |
| Last Updated | Jul 15 2026, 08:38 EDT |
| Next Release | Aug 13 2026, 08:30 EDT |
| Average Growth Rate | 3.65% |
| Value from Last Month | 202.80 |
| Change from Last Month | 1.64% |
| Value from 1 Year Ago | 169.35 |
| Change from 1 Year Ago | 21.71% |
| Frequency | Monthly |
| Unit | Index December 2003=100 |
| Adjustment | Not Seasonally Adjusted |
| Download Source File |