

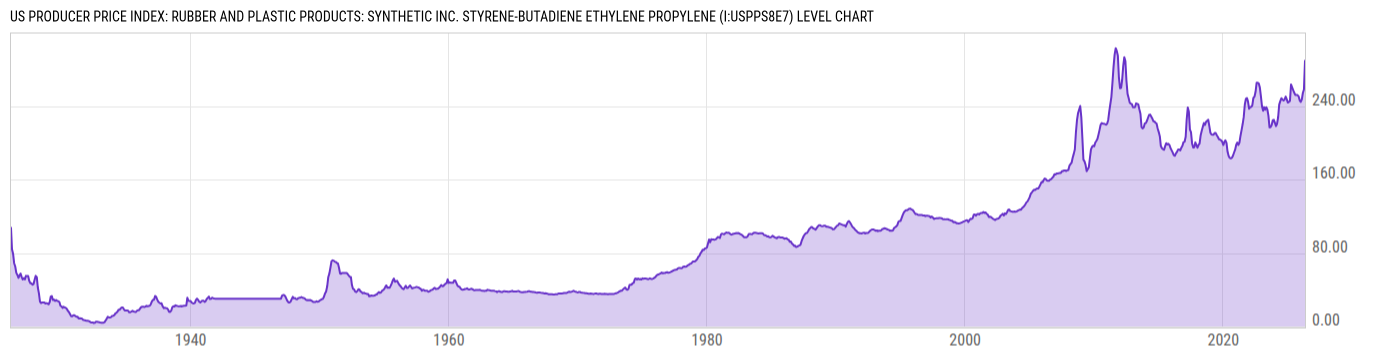
US Producer Price Index: Rubber and Plastic Products: Synthetic Inc. Styrene-butadiene Ethylene Propylene (I:USPPS8E7)
289.27 for Apr 2026
Level Chart
Basic Info
|
US Producer Price Index: Rubber and Plastic Products: Synthetic Inc. Styrene-butadiene Ethylene Propylene is at a current level of 289.27, up from 257.96 last month and up from 260.38 one year ago. This is a change of 12.14% from last month and 11.10% from one year ago. |
| Report | Producer Price Index |
| Category | Producer Prices |
| Region | United States |
| Source | Bureau of Labor Statistics |
Stats
| Last Value | 289.27 |
| Latest Period | Apr 2026 |
| Last Updated | May 13 2026, 12:11 EDT |
| Next Release | Jun 11 2026, 08:30 EDT |
| Average Growth Rate | 2.05% |
| Value from Last Month | 257.96 |
| Change from Last Month | 12.14% |
| Value from 1 Year Ago | 260.38 |
| Change from 1 Year Ago | 11.10% |
| Frequency | Monthly |
| Unit | Index 1982=100 |
| Adjustment | Not Seasonally Adjusted |
| Download Source File | |
| Notes | Sbr |
Historical Data
| Date | Value |
|---|---|
| April 30, 2026 | 289.27 |
| March 31, 2026 | 257.96 |
| February 28, 2026 | 254.16 |
| January 31, 2026 | 247.11 |
| December 31, 2025 | 244.42 |
| November 30, 2025 | 246.18 |
| October 31, 2025 | 250.54 |
| September 30, 2025 | 251.87 |
| August 31, 2025 | 251.87 |
| July 31, 2025 | 252.03 |
| June 30, 2025 | 254.40 |
| May 31, 2025 | 257.21 |
| April 30, 2025 | 260.38 |
| March 31, 2025 | 263.52 |
| February 28, 2025 | 245.46 |
| January 31, 2025 | 244.51 |
| December 31, 2024 | 243.73 |
| November 30, 2024 | 247.20 |
| October 31, 2024 | 250.17 |
| September 30, 2024 | 247.10 |
| August 31, 2024 | 246.05 |
| July 31, 2024 | 247.12 |
| June 30, 2024 | 248.40 |
| May 31, 2024 | 245.32 |
| April 30, 2024 | 241.50 |
| Date | Value |
|---|---|
| March 31, 2024 | 227.73 |
| February 29, 2024 | 220.64 |
| January 31, 2024 | 218.10 |
| December 31, 2023 | 221.58 |
| November 30, 2023 | 224.94 |
| October 31, 2023 | 224.58 |
| September 30, 2023 | 219.27 |
| August 31, 2023 | 216.95 |
| July 31, 2023 | 216.73 |
| June 30, 2023 | 229.50 |
| May 31, 2023 | 236.19 |
| April 30, 2023 | 238.67 |
| March 31, 2023 | 235.95 |
| February 28, 2023 | 238.76 |
| January 31, 2023 | 234.74 |
| December 31, 2022 | 239.34 |
| November 30, 2022 | 250.60 |
| October 31, 2022 | 260.01 |
| September 30, 2022 | 264.43 |
| August 31, 2022 | 265.42 |
| July 31, 2022 | 265.28 |
| June 30, 2022 | 255.13 |
| May 31, 2022 | 250.12 |
| April 30, 2022 | 248.71 |
| March 31, 2022 | 240.66 |
News
Headline
Time (ET)
05/22 07:41
05/13 17:00
05/13 15:57
Basic Info
|
US Producer Price Index: Rubber and Plastic Products: Synthetic Inc. Styrene-butadiene Ethylene Propylene is at a current level of 289.27, up from 257.96 last month and up from 260.38 one year ago. This is a change of 12.14% from last month and 11.10% from one year ago. |
| Report | Producer Price Index |
| Category | Producer Prices |
| Region | United States |
| Source | Bureau of Labor Statistics |
Stats
| Last Value | 289.27 |
| Latest Period | Apr 2026 |
| Last Updated | May 13 2026, 12:11 EDT |
| Next Release | Jun 11 2026, 08:30 EDT |
| Average Growth Rate | 2.05% |
| Value from Last Month | 257.96 |
| Change from Last Month | 12.14% |
| Value from 1 Year Ago | 260.38 |
| Change from 1 Year Ago | 11.10% |
| Frequency | Monthly |
| Unit | Index 1982=100 |
| Adjustment | Not Seasonally Adjusted |
| Download Source File | |
| Notes | Sbr |