

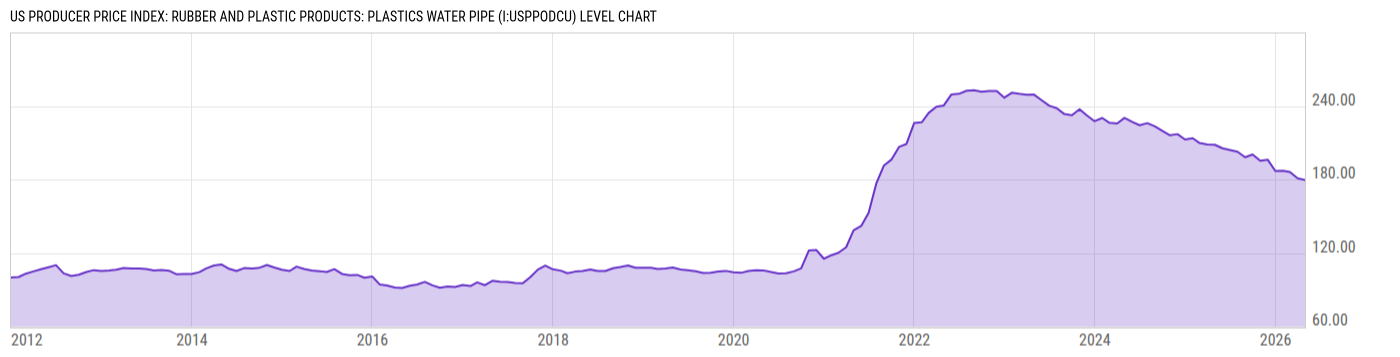
US Producer Price Index: Rubber and Plastic Products: Plastics Water Pipe (I:USPPODCU)
179.61 for Apr 2026
Level Chart
Basic Info
|
US Producer Price Index: Rubber and Plastic Products: Plastics Water Pipe is at a current level of 179.61, down from 180.98 last month and down from 208.38 one year ago. This is a change of -0.76% from last month and -13.81% from one year ago. |
| Report | Producer Price Index |
| Category | Producer Prices |
| Region | United States |
| Source | Bureau of Labor Statistics |
Stats
| Last Value | 179.61 |
| Latest Period | Apr 2026 |
| Last Updated | May 13 2026, 12:11 EDT |
| Next Release | Jun 11 2026, 08:30 EDT |
| Average Growth Rate | 4.55% |
| Value from Last Month | 180.98 |
| Change from Last Month | -0.76% |
| Value from 1 Year Ago | 208.38 |
| Change from 1 Year Ago | -13.81% |
| Frequency | Monthly |
| Unit | Index December 2011=100 |
| Adjustment | Not Seasonally Adjusted |
| Download Source File |
Historical Data
| Date | Value |
|---|---|
| April 30, 2026 | 179.61 |
| March 31, 2026 | 180.98 |
| February 28, 2026 | 186.08 |
| January 31, 2026 | 187.07 |
| December 31, 2025 | 186.92 |
| November 30, 2025 | 196.19 |
| October 31, 2025 | 195.28 |
| September 30, 2025 | 200.40 |
| August 31, 2025 | 198.17 |
| July 31, 2025 | 202.60 |
| June 30, 2025 | 204.06 |
| May 31, 2025 | 205.49 |
| April 30, 2025 | 208.38 |
| March 31, 2025 | 208.66 |
| February 28, 2025 | 209.75 |
| January 31, 2025 | 213.67 |
| December 31, 2024 | 212.69 |
| November 30, 2024 | 217.03 |
| October 31, 2024 | 216.10 |
| September 30, 2024 | 219.69 |
| August 31, 2024 | 223.34 |
| July 31, 2024 | 226.01 |
| June 30, 2024 | 224.27 |
| May 31, 2024 | 227.03 |
| April 30, 2024 | 230.28 |
| Date | Value |
|---|---|
| March 31, 2024 | 225.66 |
| February 29, 2024 | 226.27 |
| January 31, 2024 | 230.21 |
| December 31, 2023 | 227.60 |
| November 30, 2023 | 232.22 |
| October 31, 2023 | 237.37 |
| September 30, 2023 | 232.49 |
| August 31, 2023 | 233.39 |
| July 31, 2023 | 238.21 |
| June 30, 2023 | 240.34 |
| May 31, 2023 | 244.72 |
| April 30, 2023 | 249.29 |
| March 31, 2023 | 249.23 |
| February 28, 2023 | 249.94 |
| January 31, 2023 | 250.90 |
| December 31, 2022 | 246.77 |
| November 30, 2022 | 252.17 |
| October 31, 2022 | 252.32 |
| September 30, 2022 | 251.61 |
| August 31, 2022 | 252.85 |
| July 31, 2022 | 252.46 |
| June 30, 2022 | 249.90 |
| May 31, 2022 | 249.48 |
| April 30, 2022 | 240.47 |
| March 31, 2022 | 239.43 |
News
Headline
Time (ET)
05/22 07:41
05/13 17:00
05/13 15:57
Basic Info
|
US Producer Price Index: Rubber and Plastic Products: Plastics Water Pipe is at a current level of 179.61, down from 180.98 last month and down from 208.38 one year ago. This is a change of -0.76% from last month and -13.81% from one year ago. |
| Report | Producer Price Index |
| Category | Producer Prices |
| Region | United States |
| Source | Bureau of Labor Statistics |
Stats
| Last Value | 179.61 |
| Latest Period | Apr 2026 |
| Last Updated | May 13 2026, 12:11 EDT |
| Next Release | Jun 11 2026, 08:30 EDT |
| Average Growth Rate | 4.55% |
| Value from Last Month | 180.98 |
| Change from Last Month | -0.76% |
| Value from 1 Year Ago | 208.38 |
| Change from 1 Year Ago | -13.81% |
| Frequency | Monthly |
| Unit | Index December 2011=100 |
| Adjustment | Not Seasonally Adjusted |
| Download Source File |