

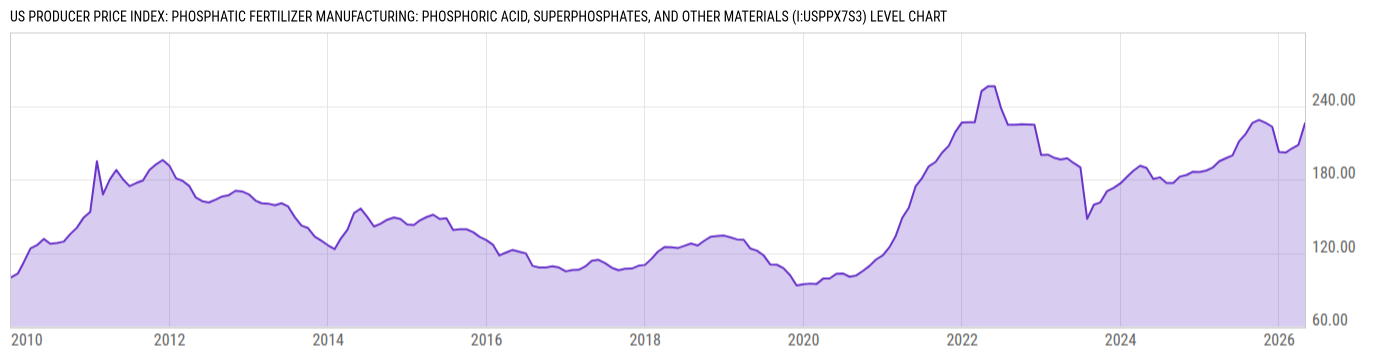
US Producer Price Index: Phosphatic Fertilizer Manufacturing: Phosphoric Acid, Superphosphates, and Other Materials (I:USPPX7S3)
225.82 for Apr 2026
Level Chart
Basic Info
|
US Producer Price Index: Phosphatic Fertilizer Manufacturing: Phosphoric Acid, Superphosphates, and Other Materials is at a current level of 225.82, up from 208.34 last month and up from 197.37 one year ago. This is a change of 8.39% from last month and 14.41% from one year ago. |
| Report | Producer Price Index |
| Category | Producer Prices |
| Region | United States |
| Source | Bureau of Labor Statistics |
Stats
| Last Value | 225.82 |
| Latest Period | Apr 2026 |
| Last Updated | May 13 2026, 12:10 EDT |
| Next Release | Jun 11 2026, 08:30 EDT |
| Average Growth Rate | 6.25% |
| Value from Last Month | 208.34 |
| Change from Last Month | 8.39% |
| Value from 1 Year Ago | 197.37 |
| Change from 1 Year Ago | 14.41% |
| Frequency | Monthly |
| Unit | Index December 2009=100 |
| Adjustment | Not Seasonally Adjusted |
| Download Source File |
Historical Data
| Date | Value |
|---|---|
| April 30, 2026 | 225.82 |
| March 31, 2026 | 208.34 |
| February 28, 2026 | 205.27 |
| January 31, 2026 | 201.98 |
| December 31, 2025 | 202.37 |
| November 30, 2025 | 223.06 |
| October 31, 2025 | 226.24 |
| September 30, 2025 | 228.66 |
| August 31, 2025 | 226.28 |
| July 31, 2025 | 217.28 |
| June 30, 2025 | 211.10 |
| May 31, 2025 | 199.69 |
| April 30, 2025 | 197.37 |
| March 31, 2025 | 194.88 |
| February 28, 2025 | 189.66 |
| January 31, 2025 | 187.36 |
| December 31, 2024 | 186.08 |
| November 30, 2024 | 186.36 |
| October 31, 2024 | 183.66 |
| September 30, 2024 | 182.36 |
| August 31, 2024 | 177.19 |
| July 31, 2024 | 177.08 |
| June 30, 2024 | 181.75 |
| May 31, 2024 | 180.40 |
| April 30, 2024 | 189.37 |
| Date | Value |
|---|---|
| March 31, 2024 | 191.21 |
| February 29, 2024 | 187.10 |
| January 31, 2024 | 182.19 |
| December 31, 2023 | 176.79 |
| November 30, 2023 | 173.15 |
| October 31, 2023 | 170.54 |
| September 30, 2023 | 161.37 |
| August 31, 2023 | 159.35 |
| July 31, 2023 | 147.86 |
| June 30, 2023 | 189.95 |
| May 31, 2023 | 193.29 |
| April 30, 2023 | 197.40 |
| March 31, 2023 | 196.29 |
| February 28, 2023 | 197.78 |
| January 31, 2023 | 200.23 |
| December 31, 2022 | 200.02 |
| November 30, 2022 | 224.67 |
| October 31, 2022 | 224.84 |
| September 30, 2022 | 225.02 |
| August 31, 2022 | 224.65 |
| July 31, 2022 | 224.65 |
| June 30, 2022 | 237.83 |
| May 31, 2022 | 256.11 |
| April 30, 2022 | 256.03 |
| March 31, 2022 | 252.14 |
News
Headline
Time (ET)
05/22 07:41
05/13 17:00
05/13 15:57
Basic Info
|
US Producer Price Index: Phosphatic Fertilizer Manufacturing: Phosphoric Acid, Superphosphates, and Other Materials is at a current level of 225.82, up from 208.34 last month and up from 197.37 one year ago. This is a change of 8.39% from last month and 14.41% from one year ago. |
| Report | Producer Price Index |
| Category | Producer Prices |
| Region | United States |
| Source | Bureau of Labor Statistics |
Stats
| Last Value | 225.82 |
| Latest Period | Apr 2026 |
| Last Updated | May 13 2026, 12:10 EDT |
| Next Release | Jun 11 2026, 08:30 EDT |
| Average Growth Rate | 6.25% |
| Value from Last Month | 208.34 |
| Change from Last Month | 8.39% |
| Value from 1 Year Ago | 197.37 |
| Change from 1 Year Ago | 14.41% |
| Frequency | Monthly |
| Unit | Index December 2009=100 |
| Adjustment | Not Seasonally Adjusted |
| Download Source File |