

US Producer Price Index: Pharmaceutical Preparation Manufacturing: Primary Products (I:USPPWLGC)
1013.59 for Apr 2026
Level Chart
Basic Info
|
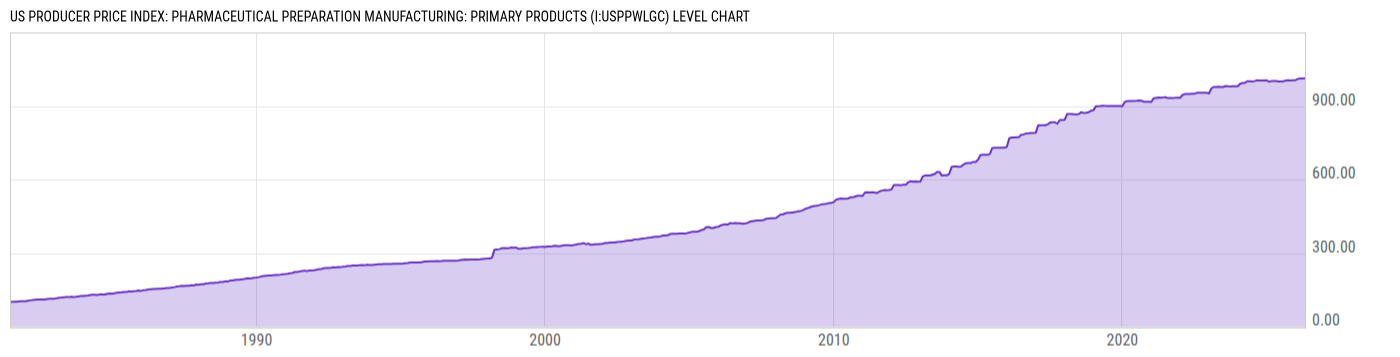
US Producer Price Index: Pharmaceutical Preparation Manufacturing: Primary Products is at a current level of 1013.59, up from 1012.62 last month and up from 1001.72 one year ago. This is a change of 0.10% from last month and 1.19% from one year ago. |
| Report | Producer Price Index |
| Category | Producer Prices |
| Region | United States |
| Source | Bureau of Labor Statistics |
Stats
| Last Value | 1013.59 |
| Latest Period | Apr 2026 |
| Last Updated | May 13 2026, 12:10 EDT |
| Next Release | Jun 11 2026, 08:30 EDT |
| Average Growth Rate | 5.22% |
| Value from Last Month | 1012.62 |
| Change from Last Month | 0.10% |
| Value from 1 Year Ago | 1001.72 |
| Change from 1 Year Ago | 1.19% |
| Frequency | Monthly |
| Unit | Index June 1981=100 |
| Adjustment | Not Seasonally Adjusted |
| Download Source File |
Historical Data
| Date | Value |
|---|---|
| April 30, 2026 | 1013.59 |
| March 31, 2026 | 1012.62 |
| February 28, 2026 | 1012.71 |
| January 31, 2026 | 1010.48 |
| December 31, 2025 | 1005.35 |
| November 30, 2025 | 1005.54 |
| October 31, 2025 | 1004.54 |
| September 30, 2025 | 1004.70 |
| August 31, 2025 | 1004.25 |
| July 31, 2025 | 1000.68 |
| June 30, 2025 | 1000.42 |
| May 31, 2025 | 999.92 |
| April 30, 2025 | 1001.72 |
| March 31, 2025 | 1002.25 |
| February 28, 2025 | 1001.67 |
| January 31, 2025 | 999.00 |
| December 31, 2024 | 1004.98 |
| November 30, 2024 | 1004.44 |
| October 31, 2024 | 1004.34 |
| September 30, 2024 | 1004.55 |
| August 31, 2024 | 1004.80 |
| July 31, 2024 | 1001.55 |
| June 30, 2024 | 1000.03 |
| May 31, 2024 | 1000.53 |
| April 30, 2024 | 1000.86 |
| Date | Value |
|---|---|
| March 31, 2024 | 994.30 |
| February 29, 2024 | 993.92 |
| January 31, 2024 | 990.85 |
| December 31, 2023 | 980.50 |
| November 30, 2023 | 980.39 |
| October 31, 2023 | 980.31 |
| September 30, 2023 | 979.99 |
| August 31, 2023 | 980.22 |
| July 31, 2023 | 981.55 |
| June 30, 2023 | 977.76 |
| May 31, 2023 | 977.51 |
| April 30, 2023 | 978.42 |
| March 31, 2023 | 977.61 |
| February 28, 2023 | 977.70 |
| January 31, 2023 | 971.17 |
| December 31, 2022 | 950.98 |
| November 30, 2022 | 954.53 |
| October 31, 2022 | 954.20 |
| September 30, 2022 | 953.67 |
| August 31, 2022 | 953.67 |
| July 31, 2022 | 953.57 |
| June 30, 2022 | 949.73 |
| May 31, 2022 | 949.52 |
| April 30, 2022 | 949.15 |
| March 31, 2022 | 948.66 |
News
Headline
Time (ET)
05/22 07:41
05/13 17:00
05/13 15:57
Basic Info
|
US Producer Price Index: Pharmaceutical Preparation Manufacturing: Primary Products is at a current level of 1013.59, up from 1012.62 last month and up from 1001.72 one year ago. This is a change of 0.10% from last month and 1.19% from one year ago. |
| Report | Producer Price Index |
| Category | Producer Prices |
| Region | United States |
| Source | Bureau of Labor Statistics |
Stats
| Last Value | 1013.59 |
| Latest Period | Apr 2026 |
| Last Updated | May 13 2026, 12:10 EDT |
| Next Release | Jun 11 2026, 08:30 EDT |
| Average Growth Rate | 5.22% |
| Value from Last Month | 1012.62 |
| Change from Last Month | 0.10% |
| Value from 1 Year Ago | 1001.72 |
| Change from 1 Year Ago | 1.19% |
| Frequency | Monthly |
| Unit | Index June 1981=100 |
| Adjustment | Not Seasonally Adjusted |
| Download Source File |