

US Producer Price Index: Health Care Services: Outpatient (I:USPPTVEN)
137.71 for Apr 2026
Level Chart
Basic Info
|
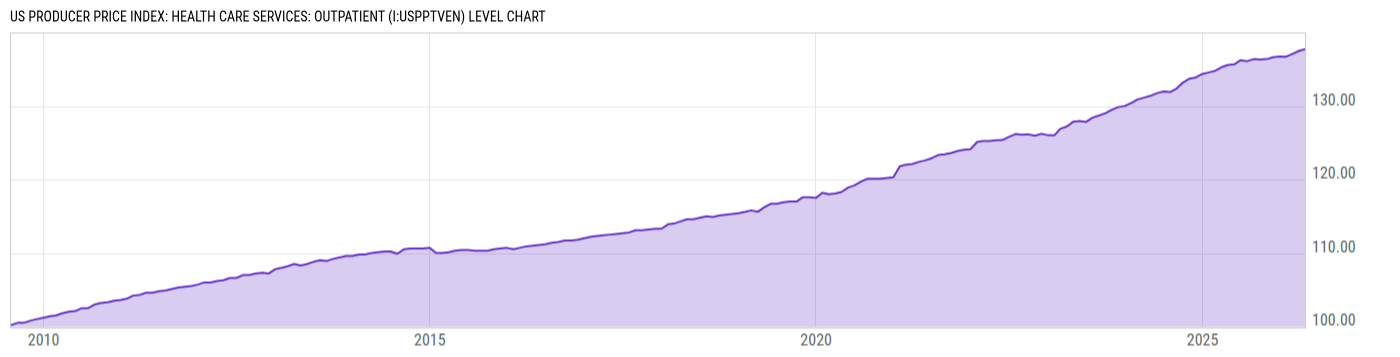
US Producer Price Index: Health Care Services: Outpatient is at a current level of 137.71, up from 137.48 last month and up from 135.58 one year ago. This is a change of 0.17% from last month and 1.57% from one year ago. |
| Report | Producer Price Index |
| Category | Producer Prices |
| Region | United States |
| Source | Bureau of Labor Statistics |
Stats
| Last Value | 137.71 |
| Latest Period | Apr 2026 |
| Last Updated | May 13 2026, 12:05 EDT |
| Next Release | Jun 11 2026, 08:30 EDT |
| Average Growth Rate | 1.90% |
| Value from Last Month | 137.48 |
| Change from Last Month | 0.17% |
| Value from 1 Year Ago | 135.58 |
| Change from 1 Year Ago | 1.57% |
| Frequency | Monthly |
| Unit | Index June 2009=100 |
| Adjustment | Seasonally Adjusted |
| Download Source File | |
| Notes | Partial |
Historical Data
| Date | Value |
|---|---|
| April 30, 2026 | 137.71 |
| March 31, 2026 | 137.48 |
| February 28, 2026 | 137.07 |
| January 31, 2026 | 136.71 |
| December 31, 2025 | 136.73 |
| November 30, 2025 | 136.62 |
| October 31, 2025 | 136.38 |
| September 30, 2025 | 136.32 |
| August 31, 2025 | 136.38 |
| July 31, 2025 | 136.10 |
| June 30, 2025 | 136.24 |
| May 31, 2025 | 135.67 |
| April 30, 2025 | 135.58 |
| March 31, 2025 | 135.27 |
| February 28, 2025 | 134.77 |
| January 31, 2025 | 134.58 |
| December 31, 2024 | 134.36 |
| November 30, 2024 | 133.88 |
| October 31, 2024 | 133.72 |
| September 30, 2024 | 133.19 |
| August 31, 2024 | 132.37 |
| July 31, 2024 | 131.90 |
| June 30, 2024 | 131.96 |
| May 31, 2024 | 131.75 |
| April 30, 2024 | 131.39 |
| Date | Value |
|---|---|
| March 31, 2024 | 131.14 |
| February 29, 2024 | 130.90 |
| January 31, 2024 | 130.43 |
| December 31, 2023 | 130.02 |
| November 30, 2023 | 129.84 |
| October 31, 2023 | 129.50 |
| September 30, 2023 | 129.03 |
| August 31, 2023 | 128.72 |
| July 31, 2023 | 128.42 |
| June 30, 2023 | 127.84 |
| May 31, 2023 | 127.95 |
| April 30, 2023 | 127.84 |
| March 31, 2023 | 127.20 |
| February 28, 2023 | 126.88 |
| January 31, 2023 | 126.01 |
| December 31, 2022 | 126.04 |
| November 30, 2022 | 126.21 |
| October 31, 2022 | 125.96 |
| September 30, 2022 | 126.14 |
| August 31, 2022 | 126.09 |
| July 31, 2022 | 126.18 |
| June 30, 2022 | 125.80 |
| May 31, 2022 | 125.36 |
| April 30, 2022 | 125.34 |
| March 31, 2022 | 125.23 |
News
Headline
Time (ET)
05/22 07:41
05/13 15:57
04/23 07:31
Basic Info
|
US Producer Price Index: Health Care Services: Outpatient is at a current level of 137.71, up from 137.48 last month and up from 135.58 one year ago. This is a change of 0.17% from last month and 1.57% from one year ago. |
| Report | Producer Price Index |
| Category | Producer Prices |
| Region | United States |
| Source | Bureau of Labor Statistics |
Stats
| Last Value | 137.71 |
| Latest Period | Apr 2026 |
| Last Updated | May 13 2026, 12:05 EDT |
| Next Release | Jun 11 2026, 08:30 EDT |
| Average Growth Rate | 1.90% |
| Value from Last Month | 137.48 |
| Change from Last Month | 0.17% |
| Value from 1 Year Ago | 135.58 |
| Change from 1 Year Ago | 1.57% |
| Frequency | Monthly |
| Unit | Index June 2009=100 |
| Adjustment | Seasonally Adjusted |
| Download Source File | |
| Notes | Partial |