

US Producer Price Index: Farm Products: Slaughter Cattle (I:USPPNU06)
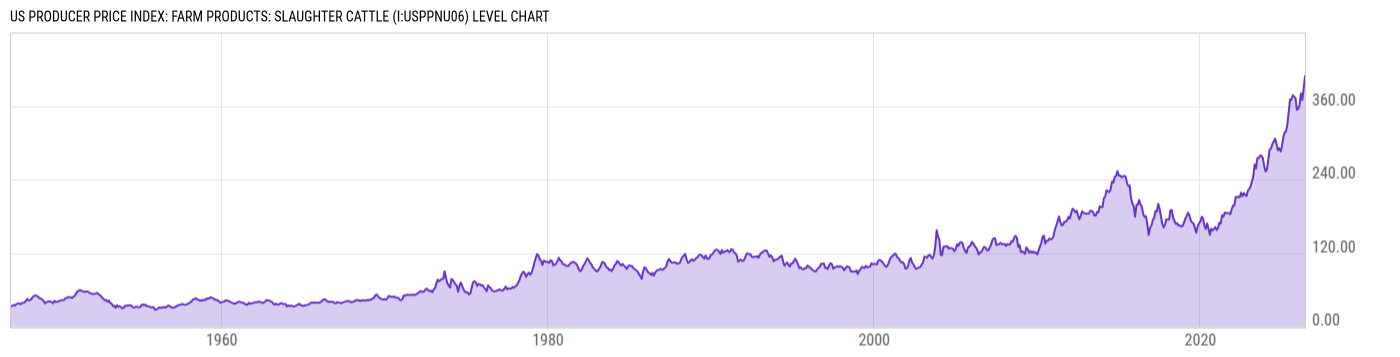
408.63 for May 2026
Level Chart
Basic Info
|
US Producer Price Index: Farm Products: Slaughter Cattle is at a current level of 408.63, up from 387.67 last month and up from 349.48 one year ago. This is a change of 5.41% from last month and 16.92% from one year ago. |
| Report | Producer Price Index |
| Category | Producer Prices |
| Region | United States |
| Source | Bureau of Labor Statistics |
Stats
| Last Value | 408.63 |
| Latest Period | May 2026 |
| Last Updated | Jun 11 2026, 10:10 EDT |
| Next Release | Jul 15 2026, 08:30 EDT |
| Average Growth Rate | 4.22% |
| Value from Last Month | 387.67 |
| Change from Last Month | 5.41% |
| Value from 1 Year Ago | 349.48 |
| Change from 1 Year Ago | 16.92% |
| Frequency | Monthly |
| Unit | Index 1982=100 |
| Adjustment | Not Seasonally Adjusted |
| Download Source File |
Historical Data
| Date | Value |
|---|---|
| May 31, 2026 | 408.63 |
| April 30, 2026 | 387.67 |
| March 31, 2026 | 369.81 |
| February 28, 2026 | 380.22 |
| January 31, 2026 | 362.07 |
| December 31, 2025 | 355.29 |
| November 30, 2025 | 353.92 |
| October 31, 2025 | 372.94 |
| September 30, 2025 | 375.32 |
| August 31, 2025 | 377.60 |
| July 31, 2025 | 370.11 |
| June 30, 2025 | 370.46 |
| May 31, 2025 | 349.48 |
| April 30, 2025 | 329.46 |
| March 31, 2025 | 318.32 |
| February 28, 2025 | 316.96 |
| January 31, 2025 | 309.17 |
| December 31, 2024 | 293.98 |
| November 30, 2024 | 285.70 |
| October 31, 2024 | 291.38 |
| September 30, 2024 | 287.98 |
| August 31, 2024 | 298.58 |
| July 31, 2024 | 306.58 |
| June 30, 2024 | 301.97 |
| May 31, 2024 | 297.88 |
| Date | Value |
|---|---|
| April 30, 2024 | 290.38 |
| March 31, 2024 | 289.33 |
| February 29, 2024 | 272.53 |
| January 31, 2024 | 256.32 |
| December 31, 2023 | 253.10 |
| November 30, 2023 | 261.77 |
| October 31, 2023 | 274.63 |
| September 30, 2023 | 278.81 |
| August 31, 2023 | 279.28 |
| July 31, 2023 | 274.98 |
| June 30, 2023 | 275.12 |
| May 31, 2023 | 257.89 |
| April 30, 2023 | 264.66 |
| March 31, 2023 | 245.31 |
| February 28, 2023 | 237.11 |
| January 31, 2023 | 228.82 |
| December 31, 2022 | 224.83 |
| November 30, 2022 | 221.94 |
| October 31, 2022 | 213.26 |
| September 30, 2022 | 214.56 |
| August 31, 2022 | 218.02 |
| July 31, 2022 | 212.54 |
| June 30, 2022 | 218.30 |
| May 31, 2022 | 210.88 |
| April 30, 2022 | 212.08 |
News
Headline
Time (ET)
06/11 13:32
05/22 07:41
Basic Info
|
US Producer Price Index: Farm Products: Slaughter Cattle is at a current level of 408.63, up from 387.67 last month and up from 349.48 one year ago. This is a change of 5.41% from last month and 16.92% from one year ago. |
| Report | Producer Price Index |
| Category | Producer Prices |
| Region | United States |
| Source | Bureau of Labor Statistics |
Stats
| Last Value | 408.63 |
| Latest Period | May 2026 |
| Last Updated | Jun 11 2026, 10:10 EDT |
| Next Release | Jul 15 2026, 08:30 EDT |
| Average Growth Rate | 4.22% |
| Value from Last Month | 387.67 |
| Change from Last Month | 5.41% |
| Value from 1 Year Ago | 349.48 |
| Change from 1 Year Ago | 16.92% |
| Frequency | Monthly |
| Unit | Index 1982=100 |
| Adjustment | Not Seasonally Adjusted |
| Download Source File |