

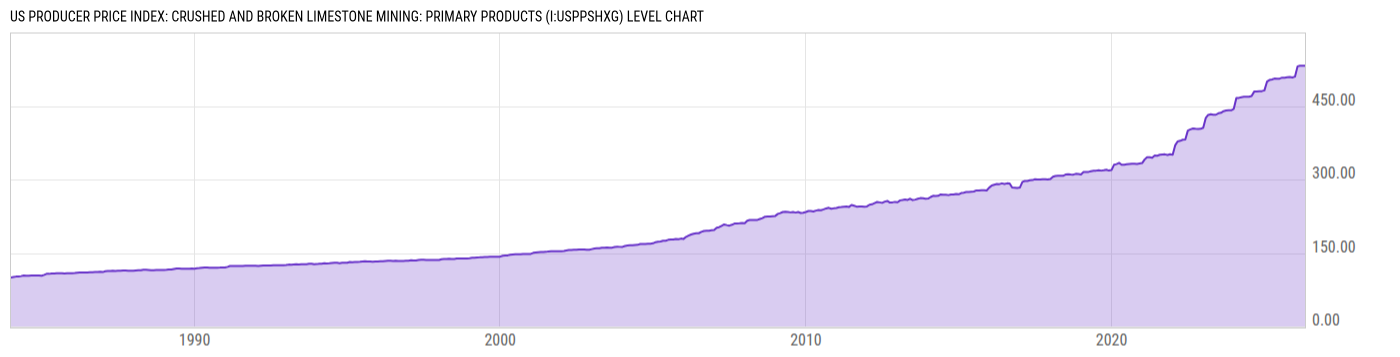
US Producer Price Index: Crushed and Broken Limestone Mining: Primary Products (I:USPPSHXG)
532.26 for Apr 2026
Level Chart
Basic Info
|
US Producer Price Index: Crushed and Broken Limestone Mining: Primary Products is at a current level of 532.26, up from 531.92 last month and up from 505.96 one year ago. This is a change of 0.06% from last month and 5.20% from one year ago. |
| Report | Producer Price Index |
| Category | Producer Prices |
| Region | United States |
| Source | Bureau of Labor Statistics |
Stats
| Last Value | 532.26 |
| Latest Period | Apr 2026 |
| Last Updated | May 13 2026, 12:03 EDT |
| Next Release | Jun 11 2026, 08:30 EDT |
| Average Growth Rate | 3.99% |
| Value from Last Month | 531.92 |
| Change from Last Month | 0.06% |
| Value from 1 Year Ago | 505.96 |
| Change from 1 Year Ago | 5.20% |
| Frequency | Monthly |
| Unit | Index December 1983=100 |
| Adjustment | Not Seasonally Adjusted |
| Download Source File |
Historical Data
| Date | Value |
|---|---|
| April 30, 2026 | 532.26 |
| March 31, 2026 | 531.92 |
| February 28, 2026 | 532.11 |
| January 31, 2026 | 530.87 |
| December 31, 2025 | 509.88 |
| November 30, 2025 | 508.23 |
| October 31, 2025 | 509.00 |
| September 30, 2025 | 508.50 |
| August 31, 2025 | 507.71 |
| July 31, 2025 | 507.82 |
| June 30, 2025 | 505.80 |
| May 31, 2025 | 505.52 |
| April 30, 2025 | 505.96 |
| March 31, 2025 | 504.18 |
| February 28, 2025 | 502.92 |
| January 31, 2025 | 499.60 |
| December 31, 2024 | 481.88 |
| November 30, 2024 | 480.27 |
| October 31, 2024 | 479.94 |
| September 30, 2024 | 479.44 |
| August 31, 2024 | 479.35 |
| July 31, 2024 | 470.46 |
| June 30, 2024 | 468.83 |
| May 31, 2024 | 468.70 |
| April 30, 2024 | 468.67 |
| Date | Value |
|---|---|
| March 31, 2024 | 468.01 |
| February 29, 2024 | 466.57 |
| January 31, 2024 | 466.31 |
| December 31, 2023 | 444.23 |
| November 30, 2023 | 441.20 |
| October 31, 2023 | 441.26 |
| September 30, 2023 | 440.71 |
| August 31, 2023 | 439.39 |
| July 31, 2023 | 436.08 |
| June 30, 2023 | 435.14 |
| May 31, 2023 | 432.16 |
| April 30, 2023 | 432.00 |
| March 31, 2023 | 433.10 |
| February 28, 2023 | 431.67 |
| January 31, 2023 | 425.82 |
| December 31, 2022 | 405.60 |
| November 30, 2022 | 403.45 |
| October 31, 2022 | 403.12 |
| September 30, 2022 | 403.52 |
| August 31, 2022 | 404.07 |
| July 31, 2022 | 402.26 |
| June 30, 2022 | 399.72 |
| May 31, 2022 | 381.66 |
| April 30, 2022 | 381.14 |
| March 31, 2022 | 378.98 |
News
Headline
Time (ET)
05/22 07:41
05/13 17:00
05/13 15:57
Basic Info
|
US Producer Price Index: Crushed and Broken Limestone Mining: Primary Products is at a current level of 532.26, up from 531.92 last month and up from 505.96 one year ago. This is a change of 0.06% from last month and 5.20% from one year ago. |
| Report | Producer Price Index |
| Category | Producer Prices |
| Region | United States |
| Source | Bureau of Labor Statistics |
Stats
| Last Value | 532.26 |
| Latest Period | Apr 2026 |
| Last Updated | May 13 2026, 12:03 EDT |
| Next Release | Jun 11 2026, 08:30 EDT |
| Average Growth Rate | 3.99% |
| Value from Last Month | 531.92 |
| Change from Last Month | 0.06% |
| Value from 1 Year Ago | 505.96 |
| Change from 1 Year Ago | 5.20% |
| Frequency | Monthly |
| Unit | Index December 1983=100 |
| Adjustment | Not Seasonally Adjusted |
| Download Source File |