

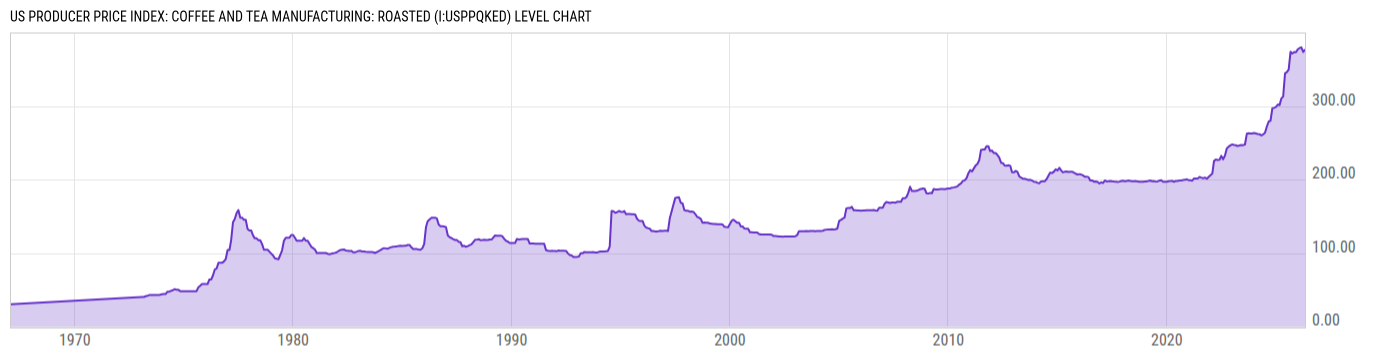
US Producer Price Index: Coffee and Tea Manufacturing: Roasted (I:USPPQKED)
376.53 for Apr 2026
Level Chart
Basic Info
|
US Producer Price Index: Coffee and Tea Manufacturing: Roasted is at a current level of 376.53, up from 373.48 last month and up from 312.88 one year ago. This is a change of 0.82% from last month and 20.34% from one year ago. |
| Report | Producer Price Index |
| Category | Producer Prices |
| Region | United States |
| Source | Bureau of Labor Statistics |
Stats
| Last Value | 376.53 |
| Latest Period | Apr 2026 |
| Last Updated | May 13 2026, 12:03 EDT |
| Next Release | Jun 11 2026, 08:30 EDT |
| Average Growth Rate | 4.74% |
| Value from Last Month | 373.48 |
| Change from Last Month | 0.82% |
| Value from 1 Year Ago | 312.88 |
| Change from 1 Year Ago | 20.34% |
| Frequency | Monthly |
| Unit | Index June 1981=100 |
| Adjustment | Not Seasonally Adjusted |
| Download Source File |
Historical Data
| Date | Value |
|---|---|
| April 30, 2026 | 376.53 |
| March 31, 2026 | 373.48 |
| February 28, 2026 | 379.82 |
| January 31, 2026 | 378.91 |
| December 31, 2025 | 377.14 |
| November 30, 2025 | 373.17 |
| October 31, 2025 | 373.30 |
| September 30, 2025 | 371.43 |
| August 31, 2025 | 373.66 |
| July 31, 2025 | 349.52 |
| June 30, 2025 | 346.11 |
| May 31, 2025 | 344.42 |
| April 30, 2025 | 312.88 |
| March 31, 2025 | 310.30 |
| February 28, 2025 | 301.20 |
| January 31, 2025 | 301.96 |
| December 31, 2024 | 298.77 |
| November 30, 2024 | 297.44 |
| October 31, 2024 | 296.86 |
| September 30, 2024 | 279.94 |
| August 31, 2024 | 278.93 |
| July 31, 2024 | 272.08 |
| June 30, 2024 | 263.65 |
| May 31, 2024 | 261.38 |
| April 30, 2024 | 259.86 |
| Date | Value |
|---|---|
| March 31, 2024 | 261.67 |
| February 29, 2024 | 262.02 |
| January 31, 2024 | 262.57 |
| December 31, 2023 | 263.15 |
| November 30, 2023 | 262.47 |
| October 31, 2023 | 262.52 |
| September 30, 2023 | 263.01 |
| August 31, 2023 | 262.16 |
| July 31, 2023 | 247.63 |
| June 30, 2023 | 246.74 |
| May 31, 2023 | 246.94 |
| April 30, 2023 | 246.37 |
| March 31, 2023 | 245.49 |
| February 28, 2023 | 246.59 |
| January 31, 2023 | 247.05 |
| December 31, 2022 | 247.77 |
| November 30, 2022 | 246.44 |
| October 31, 2022 | 244.71 |
| September 30, 2022 | 242.28 |
| August 31, 2022 | 232.61 |
| July 31, 2022 | 227.44 |
| June 30, 2022 | 232.13 |
| May 31, 2022 | 226.79 |
| April 30, 2022 | 226.67 |
| March 31, 2022 | 227.11 |
News
Headline
Time (ET)
05/22 07:41
05/13 17:00
05/13 15:57
Basic Info
|
US Producer Price Index: Coffee and Tea Manufacturing: Roasted is at a current level of 376.53, up from 373.48 last month and up from 312.88 one year ago. This is a change of 0.82% from last month and 20.34% from one year ago. |
| Report | Producer Price Index |
| Category | Producer Prices |
| Region | United States |
| Source | Bureau of Labor Statistics |
Stats
| Last Value | 376.53 |
| Latest Period | Apr 2026 |
| Last Updated | May 13 2026, 12:03 EDT |
| Next Release | Jun 11 2026, 08:30 EDT |
| Average Growth Rate | 4.74% |
| Value from Last Month | 373.48 |
| Change from Last Month | 0.82% |
| Value from 1 Year Ago | 312.88 |
| Change from 1 Year Ago | 20.34% |
| Frequency | Monthly |
| Unit | Index June 1981=100 |
| Adjustment | Not Seasonally Adjusted |
| Download Source File |