

US Producer Price Index: Chemicals and Allied Products: Carbon Black (I:USPPE4BW)
552.79 for Apr 2026
Level Chart
Basic Info
|
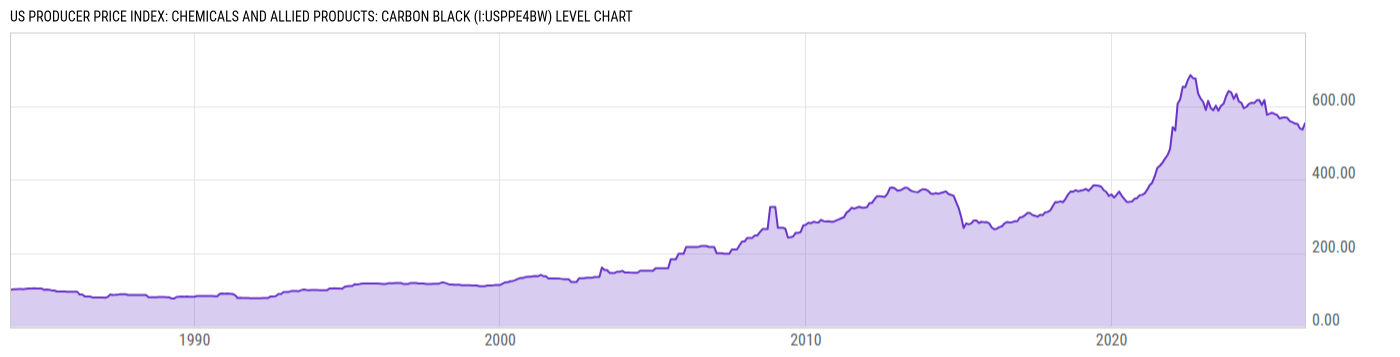
US Producer Price Index: Chemicals and Allied Products: Carbon Black is at a current level of 552.79, up from 535.81 last month and down from 578.34 one year ago. This is a change of 3.17% from last month and -4.42% from one year ago. |
| Report | Producer Price Index |
| Category | Producer Prices |
| Region | United States |
| Source | Bureau of Labor Statistics |
Stats
| Last Value | 552.79 |
| Latest Period | Apr 2026 |
| Last Updated | May 13 2026, 12:03 EDT |
| Next Release | Jun 11 2026, 08:30 EDT |
| Average Growth Rate | 4.53% |
| Value from Last Month | 535.81 |
| Change from Last Month | 3.17% |
| Value from 1 Year Ago | 578.34 |
| Change from 1 Year Ago | -4.42% |
| Frequency | Monthly |
| Unit | Index December 1983=100 |
| Adjustment | Not Seasonally Adjusted |
| Download Source File |
Historical Data
| Date | Value |
|---|---|
| April 30, 2026 | 552.79 |
| March 31, 2026 | 535.81 |
| February 28, 2026 | 539.11 |
| January 31, 2026 | 550.87 |
| December 31, 2025 | 552.33 |
| November 30, 2025 | 556.08 |
| October 31, 2025 | 558.88 |
| September 30, 2025 | 567.79 |
| August 31, 2025 | 569.09 |
| July 31, 2025 | 568.22 |
| June 30, 2025 | 565.85 |
| May 31, 2025 | 575.88 |
| April 30, 2025 | 578.34 |
| March 31, 2025 | 581.56 |
| February 28, 2025 | 578.57 |
| January 31, 2025 | 575.94 |
| December 31, 2024 | 616.24 |
| November 30, 2024 | 602.64 |
| October 31, 2024 | 616.45 |
| September 30, 2024 | 615.48 |
| August 31, 2024 | 607.96 |
| July 31, 2024 | 608.89 |
| June 30, 2024 | 605.89 |
| May 31, 2024 | 597.97 |
| April 30, 2024 | 593.87 |
| Date | Value |
|---|---|
| March 31, 2024 | 608.39 |
| February 29, 2024 | 612.58 |
| January 31, 2024 | 632.75 |
| December 31, 2023 | 619.36 |
| November 30, 2023 | 637.10 |
| October 31, 2023 | 640.77 |
| September 30, 2023 | 626.46 |
| August 31, 2023 | 606.26 |
| July 31, 2023 | 600.68 |
| June 30, 2023 | 587.17 |
| May 31, 2023 | 600.90 |
| April 30, 2023 | 588.43 |
| March 31, 2023 | 594.57 |
| February 28, 2023 | 614.02 |
| January 31, 2023 | 589.06 |
| December 31, 2022 | 610.83 |
| November 30, 2022 | 620.18 |
| October 31, 2022 | 633.95 |
| September 30, 2022 | 674.62 |
| August 31, 2022 | 675.63 |
| July 31, 2022 | 683.96 |
| June 30, 2022 | 670.87 |
| May 31, 2022 | 651.26 |
| April 30, 2022 | 652.09 |
| March 31, 2022 | 618.54 |
News
Headline
Time (ET)
05/22 07:41
05/13 17:00
05/13 15:57
Basic Info
|
US Producer Price Index: Chemicals and Allied Products: Carbon Black is at a current level of 552.79, up from 535.81 last month and down from 578.34 one year ago. This is a change of 3.17% from last month and -4.42% from one year ago. |
| Report | Producer Price Index |
| Category | Producer Prices |
| Region | United States |
| Source | Bureau of Labor Statistics |
Stats
| Last Value | 552.79 |
| Latest Period | Apr 2026 |
| Last Updated | May 13 2026, 12:03 EDT |
| Next Release | Jun 11 2026, 08:30 EDT |
| Average Growth Rate | 4.53% |
| Value from Last Month | 535.81 |
| Change from Last Month | 3.17% |
| Value from 1 Year Ago | 578.34 |
| Change from 1 Year Ago | -4.42% |
| Frequency | Monthly |
| Unit | Index December 1983=100 |
| Adjustment | Not Seasonally Adjusted |
| Download Source File |