

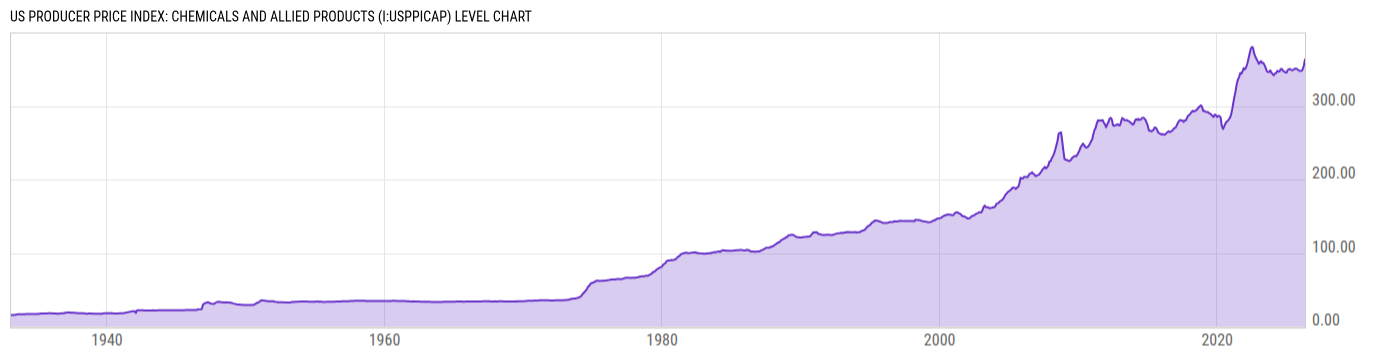
US Producer Price Index: Chemicals and Allied Products (I:USPPICAP)
363.29 for Apr 2026
Level Chart
Basic Info
|
US Producer Price Index: Chemicals and Allied Products is at a current level of 363.29, up from 355.04 last month and up from 349.22 one year ago. This is a change of 2.33% from last month and 4.03% from one year ago. |
| Report | Producer Price Index |
| Category | Producer Prices |
| Region | United States |
| Source | Bureau of Labor Statistics |
Stats
| Last Value | 363.29 |
| Latest Period | Apr 2026 |
| Last Updated | May 13 2026, 12:02 EDT |
| Next Release | Jun 11 2026, 08:30 EDT |
| Average Growth Rate | 3.48% |
| Value from Last Month | 355.04 |
| Change from Last Month | 2.33% |
| Value from 1 Year Ago | 349.22 |
| Change from 1 Year Ago | 4.03% |
| Frequency | Monthly |
| Unit | Index 1982=100 |
| Adjustment | Not Seasonally Adjusted |
| Download Source File |
Historical Data
| Date | Value |
|---|---|
| April 30, 2026 | 363.29 |
| March 31, 2026 | 355.04 |
| February 28, 2026 | 350.03 |
| January 31, 2026 | 347.79 |
| December 31, 2025 | 347.64 |
| November 30, 2025 | 348.06 |
| October 31, 2025 | 349.00 |
| September 30, 2025 | 350.53 |
| August 31, 2025 | 350.92 |
| July 31, 2025 | 350.42 |
| June 30, 2025 | 349.38 |
| May 31, 2025 | 348.61 |
| April 30, 2025 | 349.22 |
| March 31, 2025 | 350.40 |
| February 28, 2025 | 350.04 |
| January 31, 2025 | 348.90 |
| December 31, 2024 | 345.52 |
| November 30, 2024 | 345.48 |
| October 31, 2024 | 346.89 |
| September 30, 2024 | 347.78 |
| August 31, 2024 | 350.26 |
| July 31, 2024 | 350.35 |
| June 30, 2024 | 347.08 |
| May 31, 2024 | 346.89 |
| April 30, 2024 | 347.77 |
| Date | Value |
|---|---|
| March 31, 2024 | 344.88 |
| February 29, 2024 | 344.07 |
| January 31, 2024 | 341.75 |
| December 31, 2023 | 343.31 |
| November 30, 2023 | 345.29 |
| October 31, 2023 | 348.41 |
| September 30, 2023 | 346.32 |
| August 31, 2023 | 346.10 |
| July 31, 2023 | 347.28 |
| June 30, 2023 | 351.94 |
| May 31, 2023 | 355.59 |
| April 30, 2023 | 358.66 |
| March 31, 2023 | 358.31 |
| February 28, 2023 | 361.01 |
| January 31, 2023 | 359.63 |
| December 31, 2022 | 357.40 |
| November 30, 2022 | 361.03 |
| October 31, 2022 | 364.00 |
| September 30, 2022 | 367.32 |
| August 31, 2022 | 371.49 |
| July 31, 2022 | 379.07 |
| June 30, 2022 | 380.36 |
| May 31, 2022 | 377.41 |
| April 30, 2022 | 370.29 |
| March 31, 2022 | 363.56 |
News
Headline
Time (ET)
05/22 07:41
05/13 17:00
05/13 15:57
Basic Info
|
US Producer Price Index: Chemicals and Allied Products is at a current level of 363.29, up from 355.04 last month and up from 349.22 one year ago. This is a change of 2.33% from last month and 4.03% from one year ago. |
| Report | Producer Price Index |
| Category | Producer Prices |
| Region | United States |
| Source | Bureau of Labor Statistics |
Stats
| Last Value | 363.29 |
| Latest Period | Apr 2026 |
| Last Updated | May 13 2026, 12:02 EDT |
| Next Release | Jun 11 2026, 08:30 EDT |
| Average Growth Rate | 3.48% |
| Value from Last Month | 355.04 |
| Change from Last Month | 2.33% |
| Value from 1 Year Ago | 349.22 |
| Change from 1 Year Ago | 4.03% |
| Frequency | Monthly |
| Unit | Index 1982=100 |
| Adjustment | Not Seasonally Adjusted |
| Download Source File |