

US Private Service-providing Indexes of Aggregate Weekly Payrolls of Production and Nonsupervisory Employees (I:USPSHHOS)
289.90 for Apr 2026
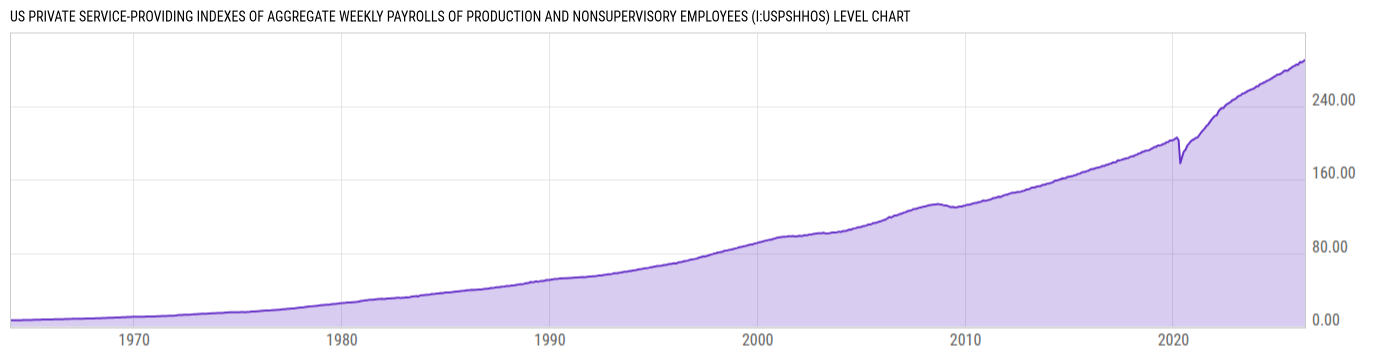
Level Chart
Basic Info
|
US Private Service-providing Indexes of Aggregate Weekly Payrolls of Production and Nonsupervisory Employees is at a current level of 289.90, up from 288.60 last month and up from 278.50 one year ago. This is a change of 0.45% from last month and 4.09% from one year ago. |
| Report | Employment Situation |
| Categories | Employment , Hours and Wages |
| Region | United States |
| Source | Bureau of Labor Statistics |
Stats
| Last Value | 289.90 |
| Latest Period | Apr 2026 |
| Last Updated | May 8 2026, 11:23 EDT |
| Next Release | Jun 5 2026, 08:30 EDT |
| Average Growth Rate | 6.07% |
| Value from Last Month | 288.60 |
| Change from Last Month | 0.45% |
| Value from 1 Year Ago | 278.50 |
| Change from 1 Year Ago | 4.09% |
| Frequency | Monthly |
| Unit | Index 2002=100 |
| Adjustment | Seasonally Adjusted |
| Download Source File |
Historical Data
| Date | Value |
|---|---|
| April 30, 2026 | 289.90 |
| March 31, 2026 | 288.60 |
| February 28, 2026 | 287.40 |
| January 31, 2026 | 287.80 |
| December 31, 2025 | 284.90 |
| November 30, 2025 | 285.20 |
| October 31, 2025 | 283.70 |
| September 30, 2025 | 283.00 |
| August 31, 2025 | 281.40 |
| July 31, 2025 | 280.20 |
| June 30, 2025 | 278.50 |
| May 31, 2025 | 278.60 |
| April 30, 2025 | 278.50 |
| March 31, 2025 | 276.50 |
| February 28, 2025 | 275.10 |
| January 31, 2025 | 274.30 |
| December 31, 2024 | 274.30 |
| November 30, 2024 | 272.70 |
| October 31, 2024 | 271.60 |
| September 30, 2024 | 270.40 |
| August 31, 2024 | 269.20 |
| July 31, 2024 | 268.20 |
| June 30, 2024 | 267.40 |
| May 31, 2024 | 266.30 |
| April 30, 2024 | 265.30 |
| Date | Value |
|---|---|
| March 31, 2024 | 264.40 |
| February 29, 2024 | 263.70 |
| January 31, 2024 | 261.40 |
| December 31, 2023 | 261.50 |
| November 30, 2023 | 259.70 |
| October 31, 2023 | 258.60 |
| September 30, 2023 | 258.20 |
| August 31, 2023 | 257.10 |
| July 31, 2023 | 256.50 |
| June 30, 2023 | 255.10 |
| May 31, 2023 | 254.00 |
| April 30, 2023 | 253.70 |
| March 31, 2023 | 251.80 |
| February 28, 2023 | 251.00 |
| January 31, 2023 | 250.10 |
| December 31, 2022 | 248.00 |
| November 30, 2022 | 247.10 |
| October 31, 2022 | 246.30 |
| September 30, 2022 | 244.40 |
| August 31, 2022 | 243.10 |
| July 31, 2022 | 242.00 |
| June 30, 2022 | 240.60 |
| May 31, 2022 | 237.90 |
| April 30, 2022 | 237.70 |
| March 31, 2022 | 236.40 |
News
Headline
Time (ET)
05/08 07:44
Basic Info
|
US Private Service-providing Indexes of Aggregate Weekly Payrolls of Production and Nonsupervisory Employees is at a current level of 289.90, up from 288.60 last month and up from 278.50 one year ago. This is a change of 0.45% from last month and 4.09% from one year ago. |
| Report | Employment Situation |
| Categories | Employment , Hours and Wages |
| Region | United States |
| Source | Bureau of Labor Statistics |
Stats
| Last Value | 289.90 |
| Latest Period | Apr 2026 |
| Last Updated | May 8 2026, 11:23 EDT |
| Next Release | Jun 5 2026, 08:30 EDT |
| Average Growth Rate | 6.07% |
| Value from Last Month | 288.60 |
| Change from Last Month | 0.45% |
| Value from 1 Year Ago | 278.50 |
| Change from 1 Year Ago | 4.09% |
| Frequency | Monthly |
| Unit | Index 2002=100 |
| Adjustment | Seasonally Adjusted |
| Download Source File |