

US People Not in Labor Force as Percent of Population (I:USPNLFPP)
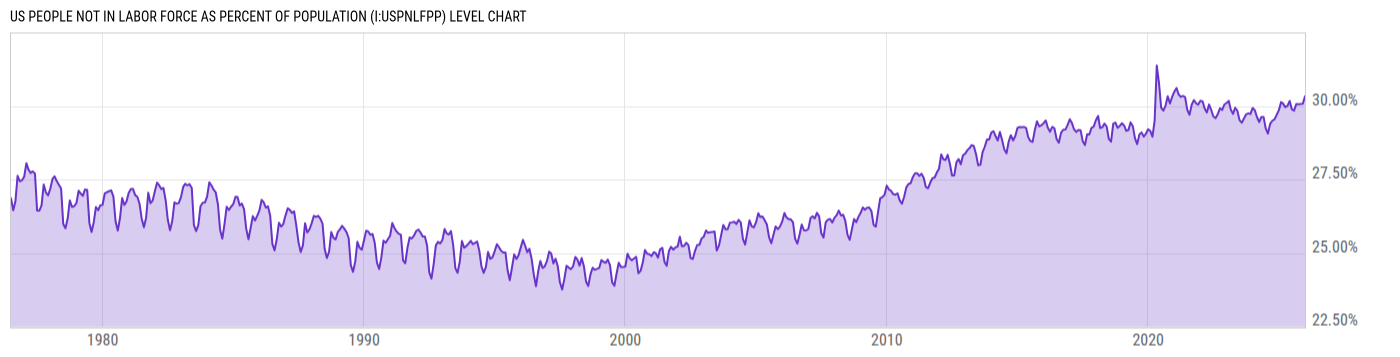
30.33% of Pop for Dec 2025
Level Chart
Basic Info
|
US People Not in Labor Force as Percent of Population is at 30.33%, compared to 30.08% last month and 29.86% last year. This is higher than the long term average of 26.85%. |
| Report | Employment Situation |
| Categories | Employment , Hours and Wages |
| Region | United States |
| Source | Bureau of Labor Statistics |
Stats
| Last Value | 30.33% |
| Latest Period | Dec 2025 |
| Last Updated | May 8 2026, 11:20 EDT |
| Long Term Average | 26.85% |
| Average Growth Rate | 0.33% |
| Value from Last Month | 30.08% |
| Change from Last Month | 0.85% |
| Value from 1 Year Ago | 29.86% |
| Change from 1 Year Ago | 1.59% |
| Frequency | Monthly |
| Unit | Percent of Population |
| Adjustment | Not Seasonally Adjusted |
| Formula | US People Not in Labor Force * 1000.00 / US Population * 10.00 |
Historical Data
| Date | Value |
|---|---|
| December 31, 2025 | 30.33% |
| November 30, 2025 | 30.08% |
| September 30, 2025 | 30.06% |
| August 31, 2025 | 30.07% |
| July 31, 2025 | 29.84% |
| June 30, 2025 | 29.89% |
| May 31, 2025 | 30.17% |
| April 30, 2025 | 30.00% |
| March 31, 2025 | 29.96% |
| February 28, 2025 | 30.08% |
| January 31, 2025 | 30.13% |
| December 31, 2024 | 29.86% |
| November 30, 2024 | 29.70% |
| October 31, 2024 | 29.54% |
| September 30, 2024 | 29.50% |
| August 31, 2024 | 29.39% |
| July 31, 2024 | 29.06% |
| June 30, 2024 | 29.24% |
| May 31, 2024 | 29.63% |
| April 30, 2024 | 29.63% |
| March 31, 2024 | 29.45% |
| February 29, 2024 | 29.63% |
| January 31, 2024 | 29.85% |
| December 31, 2023 | 29.93% |
| November 30, 2023 | 29.73% |
| Date | Value |
|---|---|
| October 31, 2023 | 29.75% |
| September 30, 2023 | 29.72% |
| August 31, 2023 | 29.57% |
| July 31, 2023 | 29.43% |
| June 30, 2023 | 29.52% |
| May 31, 2023 | 29.84% |
| April 30, 2023 | 29.94% |
| March 31, 2023 | 29.73% |
| February 28, 2023 | 29.88% |
| January 31, 2023 | 30.17% |
| December 31, 2022 | 30.10% |
| November 30, 2022 | 30.05% |
| October 31, 2022 | 29.87% |
| September 30, 2022 | 29.92% |
| August 31, 2022 | 29.73% |
| July 31, 2022 | 29.59% |
| June 30, 2022 | 29.64% |
| May 31, 2022 | 29.86% |
| April 30, 2022 | 30.05% |
| March 31, 2022 | 29.78% |
| February 28, 2022 | 29.92% |
| January 31, 2022 | 30.15% |
| December 31, 2021 | 30.18% |
| November 30, 2021 | 30.05% |
| October 31, 2021 | 30.09% |
News
Headline
Time (ET)
05/08 07:44
Basic Info
|
US People Not in Labor Force as Percent of Population is at 30.33%, compared to 30.08% last month and 29.86% last year. This is higher than the long term average of 26.85%. |
| Report | Employment Situation |
| Categories | Employment , Hours and Wages |
| Region | United States |
| Source | Bureau of Labor Statistics |
Stats
| Last Value | 30.33% |
| Latest Period | Dec 2025 |
| Last Updated | May 8 2026, 11:20 EDT |
| Long Term Average | 26.85% |
| Average Growth Rate | 0.33% |
| Value from Last Month | 30.08% |
| Change from Last Month | 0.85% |
| Value from 1 Year Ago | 29.86% |
| Change from 1 Year Ago | 1.59% |
| Frequency | Monthly |
| Unit | Percent of Population |
| Adjustment | Not Seasonally Adjusted |
| Formula | US People Not in Labor Force * 1000.00 / US Population * 10.00 |