

US New Housing Permits: 5 Units or More (I:USNHP5UM)
41.40K for Jun 2026
Level Chart
Basic Info
|
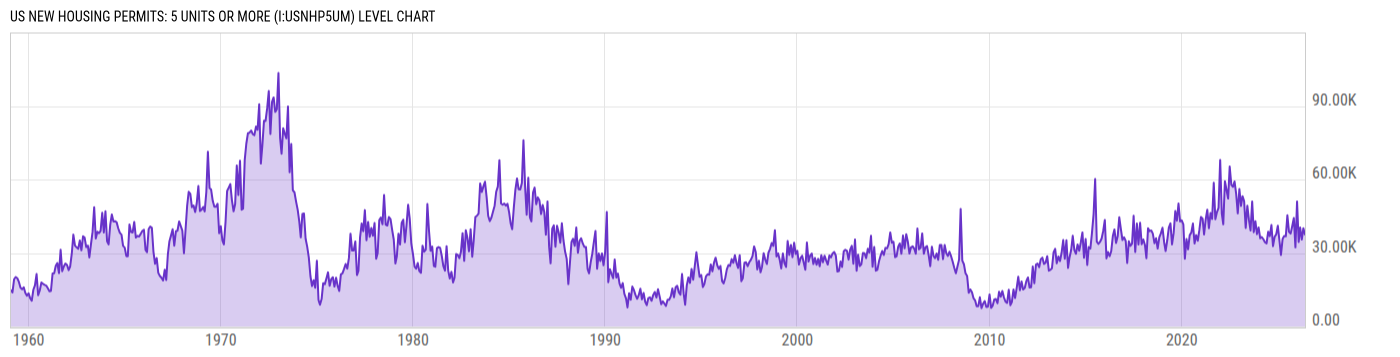
US New Housing Permits: 5 Units or More is at a current level of 41.40K, up from 36.90K last month and down from 45.40K one year ago. This is a change of 12.20% from last month and -8.81% from one year ago. |
| Report | New Residential Construction |
| Category | Construction |
| Region | United States |
| Source | Census Bureau |
Stats
| Last Value | 41.40K |
| Latest Period | Jun 2026 |
| Last Updated | Jul 17 2026, 08:33 EDT |
| Next Release | Aug 18 2026, 08:30 EDT |
| Average Growth Rate | 24.77% |
| Value from Last Month | 36.90K |
| Change from Last Month | 12.20% |
| Value from 1 Year Ago | 45.40K |
| Change from 1 Year Ago | -8.81% |
| Frequency | Monthly |
| Adjustment | Not Seasonally Adjusted |
| Download Source File |
Historical Data
| Date | Value |
|---|---|
| June 30, 2026 | 41.40K |
| May 31, 2026 | 36.90K |
| April 30, 2026 | 40.10K |
| March 31, 2026 | 35.50K |
| February 28, 2026 | 40.40K |
| January 31, 2026 | 34.50K |
| December 31, 2025 | 51.00K |
| November 30, 2025 | 32.30K |
| October 31, 2025 | 44.30K |
| September 30, 2025 | 40.90K |
| August 31, 2025 | 37.90K |
| July 31, 2025 | 38.60K |
| June 30, 2025 | 45.40K |
| May 31, 2025 | 36.80K |
| April 30, 2025 | 36.90K |
| March 31, 2025 | 35.70K |
| February 28, 2025 | 29.20K |
| January 31, 2025 | 34.90K |
| December 31, 2024 | 41.10K |
| November 30, 2024 | 37.60K |
| October 31, 2024 | 36.60K |
| September 30, 2024 | 32.80K |
| August 31, 2024 | 41.40K |
| July 31, 2024 | 36.90K |
| June 30, 2024 | 38.70K |
| Date | Value |
|---|---|
| May 31, 2024 | 33.90K |
| April 30, 2024 | 34.40K |
| March 31, 2024 | 35.60K |
| February 29, 2024 | 36.50K |
| January 31, 2024 | 36.00K |
| December 31, 2023 | 40.40K |
| November 30, 2023 | 37.70K |
| October 31, 2023 | 43.00K |
| September 30, 2023 | 38.50K |
| August 31, 2023 | 51.00K |
| July 31, 2023 | 39.20K |
| June 30, 2023 | 43.60K |
| May 31, 2023 | 49.30K |
| April 30, 2023 | 40.20K |
| March 31, 2023 | 51.20K |
| February 28, 2023 | 53.20K |
| January 31, 2023 | 49.20K |
| December 31, 2022 | 56.10K |
| November 30, 2022 | 46.20K |
| October 31, 2022 | 54.10K |
| September 30, 2022 | 59.20K |
| August 31, 2022 | 57.00K |
| July 31, 2022 | 57.80K |
| June 30, 2022 | 65.30K |
| May 31, 2022 | 52.20K |
News
Headline
Time (ET)
07/16 12:53
07/16 08:37
Basic Info
|
US New Housing Permits: 5 Units or More is at a current level of 41.40K, up from 36.90K last month and down from 45.40K one year ago. This is a change of 12.20% from last month and -8.81% from one year ago. |
| Report | New Residential Construction |
| Category | Construction |
| Region | United States |
| Source | Census Bureau |
Stats
| Last Value | 41.40K |
| Latest Period | Jun 2026 |
| Last Updated | Jul 17 2026, 08:33 EDT |
| Next Release | Aug 18 2026, 08:30 EDT |
| Average Growth Rate | 24.77% |
| Value from Last Month | 36.90K |
| Change from Last Month | 12.20% |
| Value from 1 Year Ago | 45.40K |
| Change from 1 Year Ago | -8.81% |
| Frequency | Monthly |
| Adjustment | Not Seasonally Adjusted |
| Download Source File |