

US Monthly Treasury Surplus/Defict (I:USMTSD)
215.02B USD for Apr 2026
Level Chart
Basic Info
|
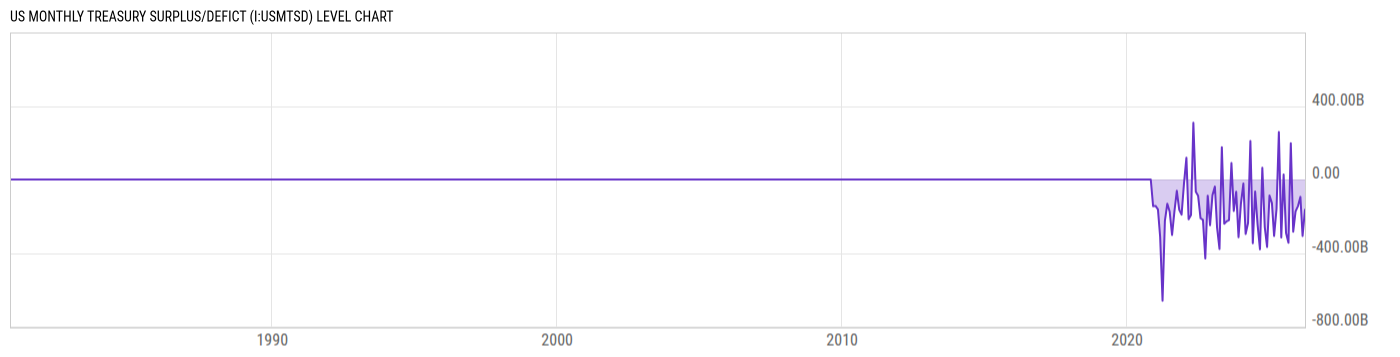
US Monthly Treasury Surplus/Defict is at a current level of 215.02B, up from -164.10B last month and down from 258.40B one year ago. This is a change of N/A from last month and -16.79% from one year ago. |
| Report | Monthly Treasury Statement |
| Category | Governmental Statistics |
| Region | United States |
| Source | Department of the Treasury |
Stats
| Last Value | 215.02B |
| Latest Period | Apr 2026 |
| Last Updated | May 12 2026, 14:05 EDT |
| Next Release | Jun 10 2026, 14:00 EDT |
| Average Growth Rate | 1.12M% |
| Value from Last Month | -164.10B |
| Change from Last Month | N/A |
| Value from 1 Year Ago | 258.40B |
| Change from 1 Year Ago | -16.79% |
| Frequency | Monthly |
| Unit | USD |
| Adjustment | N/A |
| Download Source File | |
| Notes | US Treasury surplus/deficit. |
Historical Data
| Date | Value |
|---|---|
| April 30, 2026 | 215.02B |
| March 31, 2026 | -164.10B |
| February 28, 2026 | -307.50B |
| January 31, 2026 | -94.62B |
| December 31, 2025 | -144.75B |
| November 30, 2025 | -173.28B |
| October 31, 2025 | -284.35B |
| September 30, 2025 | 197.95B |
| August 31, 2025 | -344.79B |
| July 31, 2025 | -291.14B |
| June 30, 2025 | 27.01B |
| May 31, 2025 | -316.00B |
| April 30, 2025 | 258.40B |
| March 31, 2025 | -160.53B |
| February 28, 2025 | -307.02B |
| January 31, 2025 | -128.64B |
| December 31, 2024 | -86.73B |
| November 30, 2024 | -366.76B |
| October 31, 2024 | -257.45B |
| September 30, 2024 | 64.26B |
| August 31, 2024 | -380.08B |
| July 31, 2024 | -243.74B |
| June 30, 2024 | -65.97B |
| May 31, 2024 | -347.13B |
| April 30, 2024 | 209.53B |
| Date | Value |
|---|---|
| March 31, 2024 | -236.46B |
| February 29, 2024 | -296.27B |
| January 31, 2024 | -21.93B |
| December 31, 2023 | -129.37B |
| November 30, 2023 | -314.01B |
| October 31, 2023 | -66.56B |
| September 30, 2023 | -170.98B |
| August 31, 2023 | 89.26B |
| July 31, 2023 | -220.78B |
| June 30, 2023 | -227.77B |
| May 31, 2023 | -240.35B |
| April 30, 2023 | 176.18B |
| March 31, 2023 | -378.08B |
| February 28, 2023 | -262.43B |
| January 31, 2023 | -38.78B |
| December 31, 2022 | -85.00B |
| November 30, 2022 | -248.53B |
| October 31, 2022 | -87.80B |
| September 30, 2022 | -429.67B |
| August 31, 2022 | -219.60B |
| July 31, 2022 | -211.05B |
| June 30, 2022 | -88.84B |
| May 31, 2022 | -66.22B |
| April 30, 2022 | 308.22B |
| March 31, 2022 | -192.68B |
News
Headline
Time (ET)
05/29 06:36
05/20 06:00
05/19 07:05
05/13 10:52
05/13 05:53
05/04 12:29
Basic Info
|
US Monthly Treasury Surplus/Defict is at a current level of 215.02B, up from -164.10B last month and down from 258.40B one year ago. This is a change of N/A from last month and -16.79% from one year ago. |
| Report | Monthly Treasury Statement |
| Category | Governmental Statistics |
| Region | United States |
| Source | Department of the Treasury |
Stats
| Last Value | 215.02B |
| Latest Period | Apr 2026 |
| Last Updated | May 12 2026, 14:05 EDT |
| Next Release | Jun 10 2026, 14:00 EDT |
| Average Growth Rate | 1.12M% |
| Value from Last Month | -164.10B |
| Change from Last Month | N/A |
| Value from 1 Year Ago | 258.40B |
| Change from 1 Year Ago | -16.79% |
| Frequency | Monthly |
| Unit | USD |
| Adjustment | N/A |
| Download Source File | |
| Notes | US Treasury surplus/deficit. |