

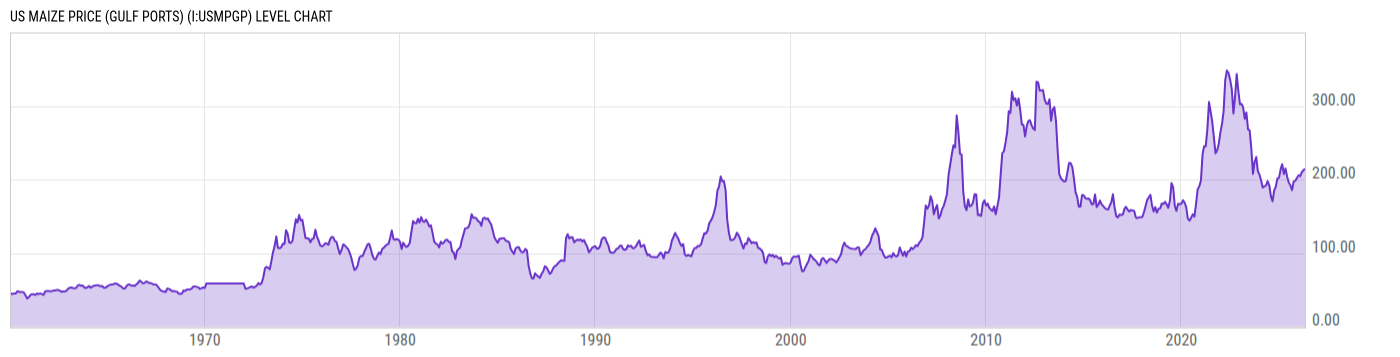
US Maize Price (Gulf Ports) (I:USMPGP)
214.00 USD/mt for Apr 2026
Level Chart
Basic Info
|
US Maize Price (Gulf Ports) is at a current level of 214.00, up from 212.69 last month and down from 215.00 one year ago. This is a change of 0.62% from last month and -0.46% from one year ago. |
| Report | Commodity Markets Review |
| Categories | Agriculture and Livestock , Chemicals , Metals |
| Region | United States |
| Source | World Bank |
Stats
| Last Value | 214.00 |
| Latest Period | Apr 2026 |
| Last Updated | May 6 2026, 09:48 EDT |
| Next Release | Jun 3 2026, 11:00 EDT (E) |
| Average Growth Rate | 4.19% |
| Value from Last Month | 212.69 |
| Change from Last Month | 0.62% |
| Value from 1 Year Ago | 215.00 |
| Change from 1 Year Ago | -0.46% |
| Frequency | Monthly |
| Unit | USD per Metric Ton |
| Adjustment | N/A |
| Download Source File | |
| Notes | No. 2, yellow, f.o.b. US Gulf ports. |
Historical Data
| Date | Value |
|---|---|
| April 30, 2026 | 214.00 |
| March 31, 2026 | 212.69 |
| February 28, 2026 | 209.59 |
| January 31, 2026 | 204.49 |
| December 31, 2025 | 205.70 |
| November 30, 2025 | 202.02 |
| October 31, 2025 | 198.13 |
| September 30, 2025 | 197.38 |
| August 31, 2025 | 185.49 |
| July 31, 2025 | 191.99 |
| June 30, 2025 | 196.07 |
| May 31, 2025 | 203.87 |
| April 30, 2025 | 215.00 |
| March 31, 2025 | 207.41 |
| February 28, 2025 | 220.88 |
| January 31, 2025 | 214.44 |
| December 31, 2024 | 202.60 |
| November 30, 2024 | 201.33 |
| October 31, 2024 | 190.34 |
| September 30, 2024 | 184.97 |
| August 31, 2024 | 170.32 |
| July 31, 2024 | 177.43 |
| June 30, 2024 | 192.51 |
| May 31, 2024 | 197.79 |
| April 30, 2024 | 191.65 |
| Date | Value |
|---|---|
| March 31, 2024 | 190.57 |
| February 29, 2024 | 189.13 |
| January 31, 2024 | 198.62 |
| December 31, 2023 | 206.55 |
| November 30, 2023 | 211.26 |
| October 31, 2023 | 230.70 |
| September 30, 2023 | 223.81 |
| August 31, 2023 | 207.61 |
| July 31, 2023 | 242.38 |
| June 30, 2023 | 266.87 |
| May 31, 2023 | 268.14 |
| April 30, 2023 | 291.11 |
| March 31, 2023 | 282.49 |
| February 28, 2023 | 298.18 |
| January 31, 2023 | 302.78 |
| December 31, 2022 | 302.25 |
| November 30, 2022 | 320.92 |
| October 31, 2022 | 343.56 |
| September 30, 2022 | 312.66 |
| August 31, 2022 | 289.84 |
| July 31, 2022 | 322.97 |
| June 30, 2022 | 335.71 |
| May 31, 2022 | 344.84 |
| April 30, 2022 | 348.17 |
| March 31, 2022 | 335.53 |
News
Headline
Time (ET)
05/21 06:34
05/15 06:43
05/14 06:43
05/13 08:44
05/13 06:37
05/11 07:48
05/11 06:37
05/06 06:45
04/29 06:32
04/28 06:44
Basic Info
|
US Maize Price (Gulf Ports) is at a current level of 214.00, up from 212.69 last month and down from 215.00 one year ago. This is a change of 0.62% from last month and -0.46% from one year ago. |
| Report | Commodity Markets Review |
| Categories | Agriculture and Livestock , Chemicals , Metals |
| Region | United States |
| Source | World Bank |
Stats
| Last Value | 214.00 |
| Latest Period | Apr 2026 |
| Last Updated | May 6 2026, 09:48 EDT |
| Next Release | Jun 3 2026, 11:00 EDT (E) |
| Average Growth Rate | 4.19% |
| Value from Last Month | 212.69 |
| Change from Last Month | 0.62% |
| Value from 1 Year Ago | 215.00 |
| Change from 1 Year Ago | -0.46% |
| Frequency | Monthly |
| Unit | USD per Metric Ton |
| Adjustment | N/A |
| Download Source File | |
| Notes | No. 2, yellow, f.o.b. US Gulf ports. |