

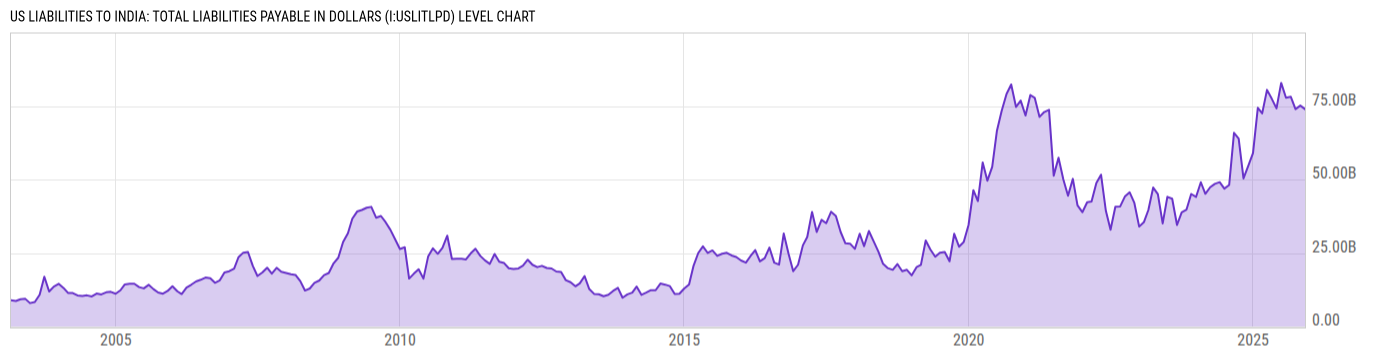
US Liabilities to India: Total Liabilities Payable in Dollars (I:USLITLPD)
78.04B USD for Mar 2026
Level Chart
Basic Info
|
US Liabilities to India: Total Liabilities Payable in Dollars is at a current level of 78.04B, up from 74.04B last month and down from 80.48B one year ago. This is a change of 5.40% from last month and -3.04% from one year ago. |
| Report | US Banking Liabilities to Foreigners |
| Category | Governmental Statistics |
| Region | United States |
| Source | Department of the Treasury |
Stats
| Last Value | 78.04B |
| Latest Period | Mar 2026 |
| Last Updated | May 18 2026, 16:02 EDT |
| Next Release | Jun 18 2026, 16:00 EDT |
| Average Growth Rate | 20.38% |
| Value from Last Month | 74.04B |
| Change from Last Month | 5.40% |
| Value from 1 Year Ago | 80.48B |
| Change from 1 Year Ago | -3.04% |
| Frequency | Monthly |
| Unit | USD |
| Adjustment | Not Seasonally Adjusted |
| Download Source File |
Historical Data
| Date | Value |
|---|---|
| March 31, 2026 | 78.04B |
| February 28, 2026 | 74.04B |
| January 31, 2026 | 75.21B |
| December 31, 2025 | 74.01B |
| November 30, 2025 | 73.95B |
| October 31, 2025 | 75.13B |
| September 30, 2025 | 73.93B |
| August 31, 2025 | 78.13B |
| July 31, 2025 | 77.80B |
| June 30, 2025 | 82.86B |
| May 31, 2025 | 74.20B |
| April 30, 2025 | 77.52B |
| March 31, 2025 | 80.48B |
| February 28, 2025 | 72.50B |
| January 31, 2025 | 74.39B |
| December 31, 2024 | 58.96B |
| November 30, 2024 | 54.57B |
| October 31, 2024 | 50.35B |
| September 30, 2024 | 63.92B |
| August 31, 2024 | 65.87B |
| July 31, 2024 | 48.12B |
| June 30, 2024 | 46.90B |
| May 31, 2024 | 49.10B |
| April 30, 2024 | 48.52B |
| March 31, 2024 | 47.36B |
| Date | Value |
|---|---|
| February 29, 2024 | 45.12B |
| January 31, 2024 | 49.06B |
| December 31, 2023 | 44.06B |
| November 30, 2023 | 45.07B |
| October 31, 2023 | 39.78B |
| September 30, 2023 | 38.81B |
| August 31, 2023 | 34.52B |
| July 31, 2023 | 43.45B |
| June 30, 2023 | 44.11B |
| May 31, 2023 | 35.06B |
| April 30, 2023 | 45.02B |
| March 31, 2023 | 47.26B |
| February 28, 2023 | 39.63B |
| January 31, 2023 | 35.57B |
| December 31, 2022 | 33.96B |
| November 30, 2022 | 42.02B |
| October 31, 2022 | 45.64B |
| September 30, 2022 | 44.18B |
| August 31, 2022 | 40.85B |
| July 31, 2022 | 40.75B |
| June 30, 2022 | 32.88B |
| May 31, 2022 | 39.36B |
| April 30, 2022 | 51.63B |
| March 31, 2022 | 48.81B |
| February 28, 2022 | 42.52B |
News
Headline
Time (ET)
05/28 10:40
05/19 07:05
05/05 06:46
Basic Info
|
US Liabilities to India: Total Liabilities Payable in Dollars is at a current level of 78.04B, up from 74.04B last month and down from 80.48B one year ago. This is a change of 5.40% from last month and -3.04% from one year ago. |
| Report | US Banking Liabilities to Foreigners |
| Category | Governmental Statistics |
| Region | United States |
| Source | Department of the Treasury |
Stats
| Last Value | 78.04B |
| Latest Period | Mar 2026 |
| Last Updated | May 18 2026, 16:02 EDT |
| Next Release | Jun 18 2026, 16:00 EDT |
| Average Growth Rate | 20.38% |
| Value from Last Month | 74.04B |
| Change from Last Month | 5.40% |
| Value from 1 Year Ago | 80.48B |
| Change from 1 Year Ago | -3.04% |
| Frequency | Monthly |
| Unit | USD |
| Adjustment | Not Seasonally Adjusted |
| Download Source File |