

US Liabilities to Australia: Total Liabilities Payable in Dollars (I:USLA9G7Z)
147.28B USD for Mar 2026
Level Chart
Basic Info
|
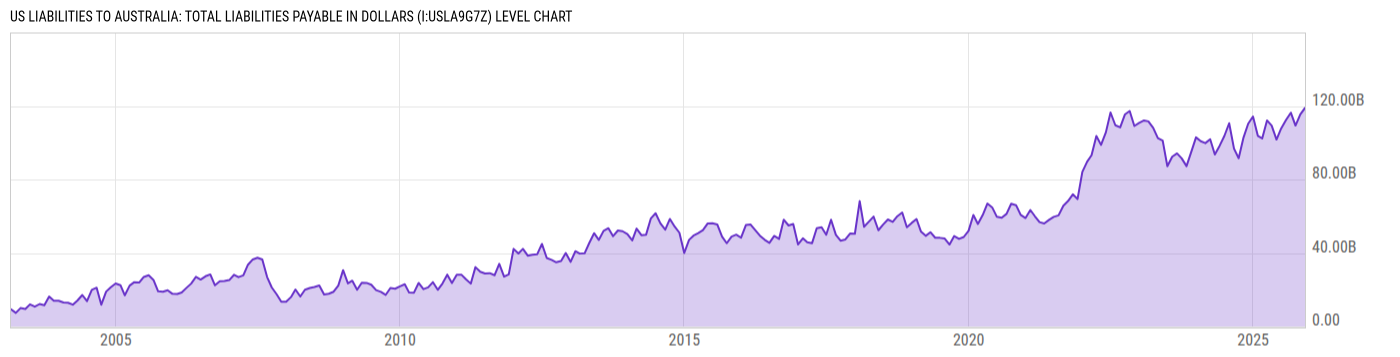
US Liabilities to Australia: Total Liabilities Payable in Dollars is at a current level of 147.28B, up from 129.87B last month and up from 112.14B one year ago. This is a change of 13.40% from last month and 31.33% from one year ago. |
| Report | US Banking Liabilities to Foreigners |
| Category | Governmental Statistics |
| Region | United States |
| Source | Department of the Treasury |
Stats
| Last Value | 147.28B |
| Latest Period | Mar 2026 |
| Last Updated | May 18 2026, 16:02 EDT |
| Next Release | Jun 18 2026, 16:00 EDT |
| Average Growth Rate | 21.67% |
| Value from Last Month | 129.87B |
| Change from Last Month | 13.40% |
| Value from 1 Year Ago | 112.14B |
| Change from 1 Year Ago | 31.33% |
| Frequency | Monthly |
| Unit | USD |
| Adjustment | Not Seasonally Adjusted |
| Download Source File |
Historical Data
| Date | Value |
|---|---|
| March 31, 2026 | 147.28B |
| February 28, 2026 | 129.87B |
| January 31, 2026 | 118.80B |
| December 31, 2025 | 121.35B |
| November 30, 2025 | 118.94B |
| October 31, 2025 | 115.43B |
| September 30, 2025 | 109.34B |
| August 31, 2025 | 116.35B |
| July 31, 2025 | 112.35B |
| June 30, 2025 | 107.80B |
| May 31, 2025 | 101.72B |
| April 30, 2025 | 109.32B |
| March 31, 2025 | 112.14B |
| February 28, 2025 | 102.33B |
| January 31, 2025 | 103.78B |
| December 31, 2024 | 114.28B |
| November 30, 2024 | 110.32B |
| October 31, 2024 | 102.82B |
| September 30, 2024 | 91.58B |
| August 31, 2024 | 96.80B |
| July 31, 2024 | 110.62B |
| June 30, 2024 | 103.68B |
| May 31, 2024 | 98.42B |
| April 30, 2024 | 93.64B |
| March 31, 2024 | 101.93B |
| Date | Value |
|---|---|
| February 29, 2024 | 99.80B |
| January 31, 2024 | 100.81B |
| December 31, 2023 | 102.94B |
| November 30, 2023 | 94.92B |
| October 31, 2023 | 87.28B |
| September 30, 2023 | 91.51B |
| August 31, 2023 | 94.20B |
| July 31, 2023 | 92.38B |
| June 30, 2023 | 87.23B |
| May 31, 2023 | 101.12B |
| April 30, 2023 | 102.47B |
| March 31, 2023 | 108.14B |
| February 28, 2023 | 111.63B |
| January 31, 2023 | 112.14B |
| December 31, 2022 | 110.83B |
| November 30, 2022 | 109.12B |
| October 31, 2022 | 117.25B |
| September 30, 2022 | 115.35B |
| August 31, 2022 | 108.33B |
| July 31, 2022 | 109.52B |
| June 30, 2022 | 116.47B |
| May 31, 2022 | 105.64B |
| April 30, 2022 | 98.86B |
| March 31, 2022 | 103.69B |
| February 28, 2022 | 93.20B |
News
Headline
Time (ET)
05/28 10:40
05/19 07:05
05/05 06:46
04/28 06:44
Basic Info
|
US Liabilities to Australia: Total Liabilities Payable in Dollars is at a current level of 147.28B, up from 129.87B last month and up from 112.14B one year ago. This is a change of 13.40% from last month and 31.33% from one year ago. |
| Report | US Banking Liabilities to Foreigners |
| Category | Governmental Statistics |
| Region | United States |
| Source | Department of the Treasury |
Stats
| Last Value | 147.28B |
| Latest Period | Mar 2026 |
| Last Updated | May 18 2026, 16:02 EDT |
| Next Release | Jun 18 2026, 16:00 EDT |
| Average Growth Rate | 21.67% |
| Value from Last Month | 129.87B |
| Change from Last Month | 13.40% |
| Value from 1 Year Ago | 112.14B |
| Change from 1 Year Ago | 31.33% |
| Frequency | Monthly |
| Unit | USD |
| Adjustment | Not Seasonally Adjusted |
| Download Source File |