

US Leisure and Hospitality, Accommodation and Food Services Real Average Hourly Earnings of Production and Nonsupervisory Employees (I:USLHV7ON)
6.26 1982-84 USD for Mar 2026
Level Chart
Basic Info
|
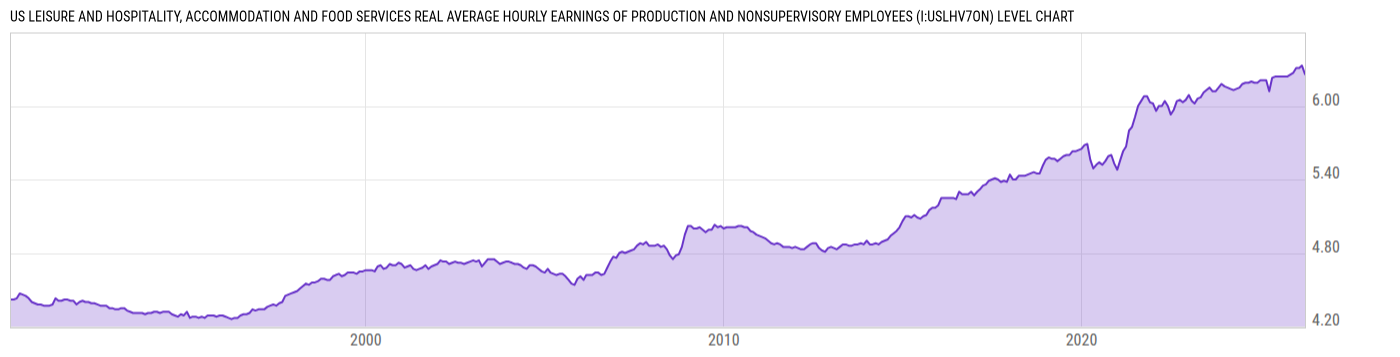
US Leisure and Hospitality, Accommodation and Food Services Real Average Hourly Earnings of Production and Nonsupervisory Employees is at a current level of 6.26, down from 6.33 last month and up from 6.12 one year ago. This is a change of -1.11% from last month and 2.29% from one year ago. |
| Report | Real Earnings |
| Category | Hours and Wages |
| Region | United States |
| Source | Bureau of Labor Statistics |
Stats
| Last Value | 6.26 |
| Latest Period | Mar 2026 |
| Last Updated | May 8 2026, 12:14 EDT |
| Next Release | Jun 5 2026, 08:30 EDT |
| Average Growth Rate | 0.97% |
| Value from Last Month | 6.33 |
| Change from Last Month | -1.11% |
| Value from 1 Year Ago | 6.12 |
| Change from 1 Year Ago | 2.29% |
| Frequency | Monthly |
| Unit | 1982-84 USD |
| Adjustment | Seasonally Adjusted |
| Download Source File |
Historical Data
| Date | Value |
|---|---|
| March 31, 2026 | 6.26 |
| February 28, 2026 | 6.33 |
| January 31, 2026 | 6.31 |
| December 31, 2025 | 6.31 |
| November 30, 2025 | 6.27 |
| October 31, 2025 | |
| September 30, 2025 | 6.24 |
| August 31, 2025 | 6.24 |
| July 31, 2025 | 6.24 |
| June 30, 2025 | 6.24 |
| May 31, 2025 | 6.24 |
| April 30, 2025 | 6.23 |
| March 31, 2025 | 6.12 |
| February 28, 2025 | 6.21 |
| January 31, 2025 | 6.21 |
| December 31, 2024 | 6.21 |
| November 30, 2024 | 6.19 |
| October 31, 2024 | 6.19 |
| September 30, 2024 | 6.20 |
| August 31, 2024 | 6.19 |
| July 31, 2024 | 6.19 |
| June 30, 2024 | 6.18 |
| May 31, 2024 | 6.15 |
| April 30, 2024 | 6.14 |
| March 31, 2024 | 6.13 |
| Date | Value |
|---|---|
| February 29, 2024 | 6.14 |
| January 31, 2024 | 6.15 |
| December 31, 2023 | 6.16 |
| November 30, 2023 | 6.18 |
| October 31, 2023 | 6.15 |
| September 30, 2023 | 6.12 |
| August 31, 2023 | 6.12 |
| July 31, 2023 | 6.15 |
| June 30, 2023 | 6.13 |
| May 31, 2023 | 6.11 |
| April 30, 2023 | 6.07 |
| March 31, 2023 | 6.06 |
| February 28, 2023 | 6.02 |
| January 31, 2023 | 6.04 |
| December 31, 2022 | 6.09 |
| November 30, 2022 | 6.05 |
| October 31, 2022 | 6.03 |
| September 30, 2022 | 6.05 |
| August 31, 2022 | 6.04 |
| July 31, 2022 | 5.97 |
| June 30, 2022 | 5.93 |
| May 31, 2022 | 6.00 |
| April 30, 2022 | 6.04 |
| March 31, 2022 | 6.00 |
| February 28, 2022 | 6.00 |
News
Headline
Time (ET)
05/29 14:15
Basic Info
|
US Leisure and Hospitality, Accommodation and Food Services Real Average Hourly Earnings of Production and Nonsupervisory Employees is at a current level of 6.26, down from 6.33 last month and up from 6.12 one year ago. This is a change of -1.11% from last month and 2.29% from one year ago. |
| Report | Real Earnings |
| Category | Hours and Wages |
| Region | United States |
| Source | Bureau of Labor Statistics |
Stats
| Last Value | 6.26 |
| Latest Period | Mar 2026 |
| Last Updated | May 8 2026, 12:14 EDT |
| Next Release | Jun 5 2026, 08:30 EDT |
| Average Growth Rate | 0.97% |
| Value from Last Month | 6.33 |
| Change from Last Month | -1.11% |
| Value from 1 Year Ago | 6.12 |
| Change from 1 Year Ago | 2.29% |
| Frequency | Monthly |
| Unit | 1982-84 USD |
| Adjustment | Seasonally Adjusted |
| Download Source File |