

US Labor Force (I:USLFCF6I)
169.36M for Jun 2026
Level Chart
Basic Info
|
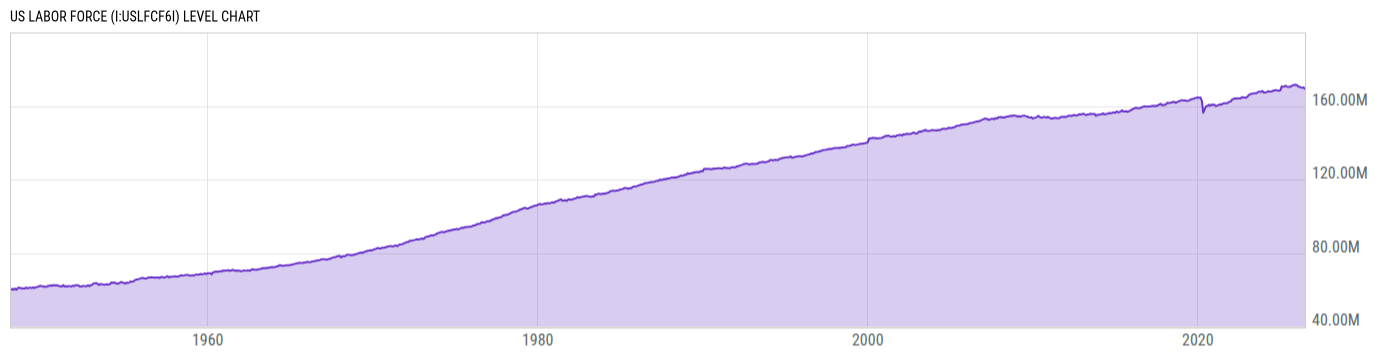
US Labor Force is at a current level of 169.36M, down from 170.08M last month and down from 170.38M one year ago. This is a change of -0.42% from last month and -0.60% from one year ago. |
| Report | Employment Situation |
| Categories | Employment , Hours and Wages |
| Region | United States |
| Source | Bureau of Labor Statistics |
Stats
| Last Value | 169.36M |
| Latest Period | Jun 2026 |
| Last Updated | Jul 2 2026, 12:47 EDT |
| Next Release | Aug 7 2026, 08:30 EDT |
| Average Growth Rate | 1.33% |
| Value from Last Month | 170.08M |
| Change from Last Month | -0.42% |
| Value from 1 Year Ago | 170.38M |
| Change from 1 Year Ago | -0.60% |
| Frequency | Monthly |
| Adjustment | Seasonally Adjusted |
| Download Source File |
Historical Data
| Date | Value |
|---|---|
| June 30, 2026 | 169.36M |
| May 31, 2026 | 170.08M |
| April 30, 2026 | 170.00M |
| March 31, 2026 | 170.09M |
| February 28, 2026 | 170.48M |
| January 31, 2026 | 170.46M |
| December 31, 2025 | 171.50M |
| November 30, 2025 | 171.54M |
| October 31, 2025 | |
| September 30, 2025 | 171.26M |
| August 31, 2025 | 170.75M |
| July 31, 2025 | 170.41M |
| June 30, 2025 | 170.38M |
| May 31, 2025 | 170.49M |
| April 30, 2025 | 171.05M |
| March 31, 2025 | 170.64M |
| February 28, 2025 | 170.44M |
| January 31, 2025 | 170.70M |
| December 31, 2024 | 168.51M |
| November 30, 2024 | 168.25M |
| October 31, 2024 | 168.40M |
| September 30, 2024 | 168.66M |
| August 31, 2024 | 168.49M |
| July 31, 2024 | 168.40M |
| June 30, 2024 | 168.03M |
| Date | Value |
|---|---|
| May 31, 2024 | 167.81M |
| April 30, 2024 | 167.92M |
| March 31, 2024 | 167.98M |
| February 29, 2024 | 167.57M |
| January 31, 2024 | 167.31M |
| December 31, 2023 | 167.39M |
| November 30, 2023 | 168.14M |
| October 31, 2023 | 167.69M |
| September 30, 2023 | 167.77M |
| August 31, 2023 | 167.76M |
| July 31, 2023 | 167.10M |
| June 30, 2023 | 166.94M |
| May 31, 2023 | 166.89M |
| April 30, 2023 | 166.72M |
| March 31, 2023 | 166.65M |
| February 28, 2023 | 166.36M |
| January 31, 2023 | 165.96M |
| December 31, 2022 | 165.02M |
| November 30, 2022 | 164.44M |
| October 31, 2022 | 164.68M |
| September 30, 2022 | 164.65M |
| August 31, 2022 | 164.74M |
| July 31, 2022 | 164.06M |
| June 30, 2022 | 164.10M |
| May 31, 2022 | 164.28M |
News
Headline
Time (ET)
07/13 09:06
07/10 08:58
07/02 16:13
Basic Info
|
US Labor Force is at a current level of 169.36M, down from 170.08M last month and down from 170.38M one year ago. This is a change of -0.42% from last month and -0.60% from one year ago. |
| Report | Employment Situation |
| Categories | Employment , Hours and Wages |
| Region | United States |
| Source | Bureau of Labor Statistics |
Stats
| Last Value | 169.36M |
| Latest Period | Jun 2026 |
| Last Updated | Jul 2 2026, 12:47 EDT |
| Next Release | Aug 7 2026, 08:30 EDT |
| Average Growth Rate | 1.33% |
| Value from Last Month | 170.08M |
| Change from Last Month | -0.42% |
| Value from 1 Year Ago | 170.38M |
| Change from 1 Year Ago | -0.60% |
| Frequency | Monthly |
| Adjustment | Seasonally Adjusted |
| Download Source File |