

US Job Separation Expectations - Losing a Job (I:USJSELJ)
14.59% for Apr 2026
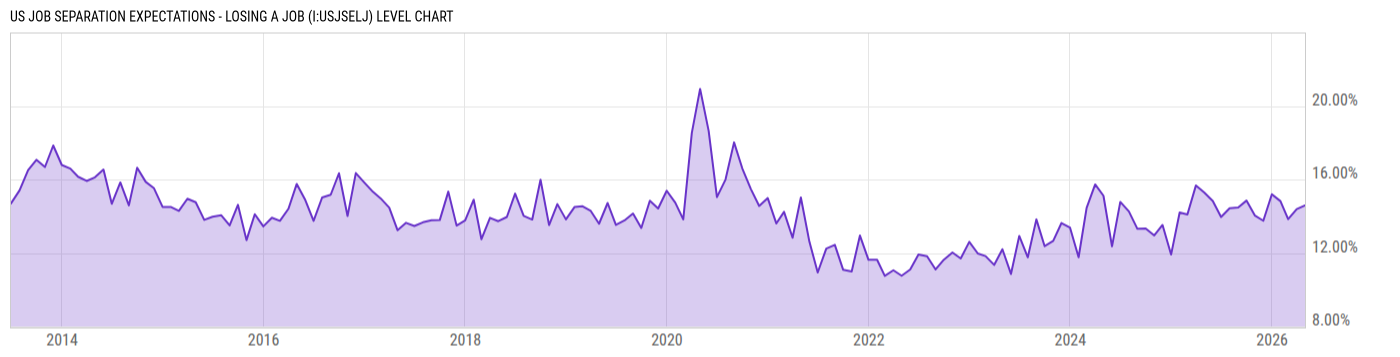
Level Chart
Basic Info
|
US Job Separation Expectations - Losing a Job is at 14.59%, compared to 14.39% last month and 15.29% last year. This is higher than the long term average of 14.15%. |
| Report | Survey of Consumer Expectations |
| Category | Consumer & Household Statistics |
| Region | United States |
| Source | Federal Reserve Bank of New York |
Stats
| Last Value | 14.59% |
| Latest Period | Apr 2026 |
| Last Updated | May 7 2026, 11:03 EDT |
| Next Release | Jun 8 2026, 09:00 EDT (E) |
| Long Term Average | 14.15% |
| Average Growth Rate | 4.37% |
| Value from Last Month | 14.39% |
| Change from Last Month | 1.38% |
| Value from 1 Year Ago | 15.29% |
| Change from 1 Year Ago | -4.61% |
| Frequency | Monthly |
| Unit | Percent |
| Adjustment | N/A |
| Download Source File | |
| Notes | Mean probability of losing a job over the next 12 months |
Historical Data
| Date | Value |
|---|---|
| April 30, 2026 | 14.59% |
| March 31, 2026 | 14.39% |
| February 28, 2026 | 13.84% |
| January 31, 2026 | 14.82% |
| December 31, 2025 | 15.20% |
| November 30, 2025 | 13.76% |
| October 31, 2025 | 14.03% |
| September 30, 2025 | 14.85% |
| August 31, 2025 | 14.48% |
| July 31, 2025 | 14.43% |
| June 30, 2025 | 13.96% |
| May 31, 2025 | 14.83% |
| April 30, 2025 | 15.29% |
| March 31, 2025 | 15.68% |
| February 28, 2025 | 14.10% |
| January 31, 2025 | 14.21% |
| December 31, 2024 | 11.91% |
| November 30, 2024 | 13.52% |
| October 31, 2024 | 12.96% |
| September 30, 2024 | 13.33% |
| August 31, 2024 | 13.32% |
| July 31, 2024 | 14.27% |
| June 30, 2024 | 14.78% |
| May 31, 2024 | 12.36% |
| April 30, 2024 | 15.12% |
| Date | Value |
|---|---|
| March 31, 2024 | 15.73% |
| February 29, 2024 | 14.45% |
| January 31, 2024 | 11.77% |
| December 31, 2023 | 13.37% |
| November 30, 2023 | 13.63% |
| October 31, 2023 | 12.66% |
| September 30, 2023 | 12.37% |
| August 31, 2023 | 13.83% |
| July 31, 2023 | 11.77% |
| June 30, 2023 | 12.93% |
| May 31, 2023 | 10.86% |
| April 30, 2023 | 12.20% |
| March 31, 2023 | 11.35% |
| February 28, 2023 | 11.83% |
| January 31, 2023 | 11.97% |
| December 31, 2022 | 12.60% |
| November 30, 2022 | 11.70% |
| October 31, 2022 | 12.03% |
| September 30, 2022 | 11.64% |
| August 31, 2022 | 11.11% |
| July 31, 2022 | 11.82% |
| June 30, 2022 | 11.92% |
| May 31, 2022 | 11.10% |
| April 30, 2022 | 10.76% |
| March 31, 2022 | 11.06% |
News
Headline
Time (ET)
04/24 14:16
04/20 07:46
Basic Info
|
US Job Separation Expectations - Losing a Job is at 14.59%, compared to 14.39% last month and 15.29% last year. This is higher than the long term average of 14.15%. |
| Report | Survey of Consumer Expectations |
| Category | Consumer & Household Statistics |
| Region | United States |
| Source | Federal Reserve Bank of New York |
Stats
| Last Value | 14.59% |
| Latest Period | Apr 2026 |
| Last Updated | May 7 2026, 11:03 EDT |
| Next Release | Jun 8 2026, 09:00 EDT (E) |
| Long Term Average | 14.15% |
| Average Growth Rate | 4.37% |
| Value from Last Month | 14.39% |
| Change from Last Month | 1.38% |
| Value from 1 Year Ago | 15.29% |
| Change from 1 Year Ago | -4.61% |
| Frequency | Monthly |
| Unit | Percent |
| Adjustment | N/A |
| Download Source File | |
| Notes | Mean probability of losing a job over the next 12 months |