

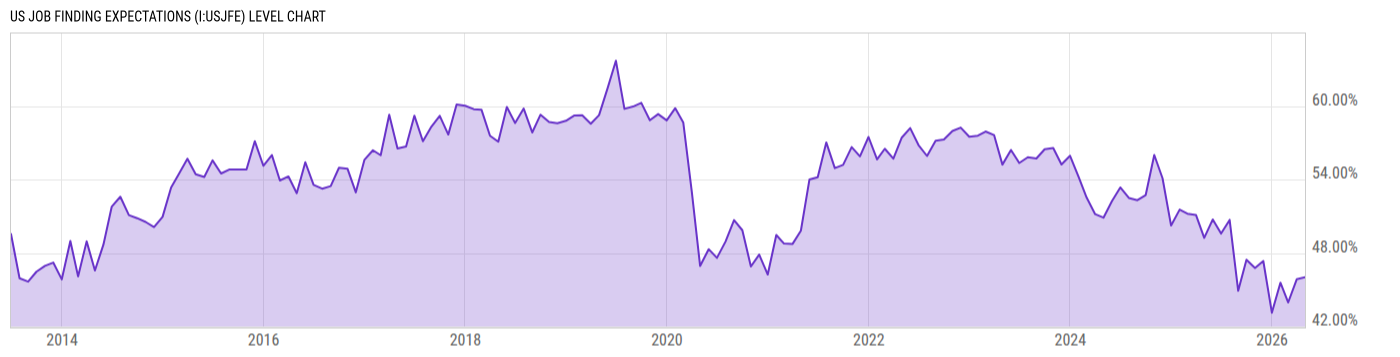
US Job Finding Expectations (I:USJFE)
46.02% for Apr 2026
Level Chart
Basic Info
|
US Job Finding Expectations is at 46.02%, compared to 45.85% last month and 49.23% last year. This is lower than the long term average of 53.93%. |
| Report | Survey of Consumer Expectations |
| Category | Consumer & Household Statistics |
| Region | United States |
| Source | Federal Reserve Bank of New York |
Stats
| Last Value | 46.02% |
| Latest Period | Apr 2026 |
| Last Updated | May 7 2026, 11:03 EDT |
| Next Release | Jun 8 2026, 09:00 EDT (E) |
| Long Term Average | 53.93% |
| Average Growth Rate | 0.13% |
| Value from Last Month | 45.85% |
| Change from Last Month | 0.38% |
| Value from 1 Year Ago | 49.23% |
| Change from 1 Year Ago | -6.52% |
| Frequency | Monthly |
| Unit | Percent |
| Adjustment | N/A |
| Download Source File | |
| Notes | Mean probability of finding a job in the next three months if lose job today. |
Historical Data
| Date | Value |
|---|---|
| April 30, 2026 | 46.02% |
| March 31, 2026 | 45.85% |
| February 28, 2026 | 43.96% |
| January 31, 2026 | 45.57% |
| December 31, 2025 | 43.13% |
| November 30, 2025 | 47.35% |
| October 31, 2025 | 46.77% |
| September 30, 2025 | 47.45% |
| August 31, 2025 | 44.91% |
| July 31, 2025 | 50.70% |
| June 30, 2025 | 49.59% |
| May 31, 2025 | 50.74% |
| April 30, 2025 | 49.23% |
| March 31, 2025 | 51.11% |
| February 28, 2025 | 51.21% |
| January 31, 2025 | 51.54% |
| December 31, 2024 | 50.24% |
| November 30, 2024 | 54.10% |
| October 31, 2024 | 56.00% |
| September 30, 2024 | 52.73% |
| August 31, 2024 | 52.31% |
| July 31, 2024 | 52.50% |
| June 30, 2024 | 53.35% |
| May 31, 2024 | 52.24% |
| April 30, 2024 | 50.88% |
| Date | Value |
|---|---|
| March 31, 2024 | 51.17% |
| February 29, 2024 | 52.53% |
| January 31, 2024 | 54.21% |
| December 31, 2023 | 55.93% |
| November 30, 2023 | 55.23% |
| October 31, 2023 | 56.57% |
| September 30, 2023 | 56.47% |
| August 31, 2023 | 55.72% |
| July 31, 2023 | 55.82% |
| June 30, 2023 | 55.35% |
| May 31, 2023 | 56.41% |
| April 30, 2023 | 55.21% |
| March 31, 2023 | 57.62% |
| February 28, 2023 | 57.92% |
| January 31, 2023 | 57.57% |
| December 31, 2022 | 57.49% |
| November 30, 2022 | 58.24% |
| October 31, 2022 | 57.96% |
| September 30, 2022 | 57.26% |
| August 31, 2022 | 57.17% |
| July 31, 2022 | 55.92% |
| June 30, 2022 | 56.81% |
| May 31, 2022 | 58.20% |
| April 30, 2022 | 57.41% |
| March 31, 2022 | 55.70% |
News
Headline
Time (ET)
04/24 14:16
04/20 07:46
Basic Info
|
US Job Finding Expectations is at 46.02%, compared to 45.85% last month and 49.23% last year. This is lower than the long term average of 53.93%. |
| Report | Survey of Consumer Expectations |
| Category | Consumer & Household Statistics |
| Region | United States |
| Source | Federal Reserve Bank of New York |
Stats
| Last Value | 46.02% |
| Latest Period | Apr 2026 |
| Last Updated | May 7 2026, 11:03 EDT |
| Next Release | Jun 8 2026, 09:00 EDT (E) |
| Long Term Average | 53.93% |
| Average Growth Rate | 0.13% |
| Value from Last Month | 45.85% |
| Change from Last Month | 0.38% |
| Value from 1 Year Ago | 49.23% |
| Change from 1 Year Ago | -6.52% |
| Frequency | Monthly |
| Unit | Percent |
| Adjustment | N/A |
| Download Source File | |
| Notes | Mean probability of finding a job in the next three months if lose job today. |