

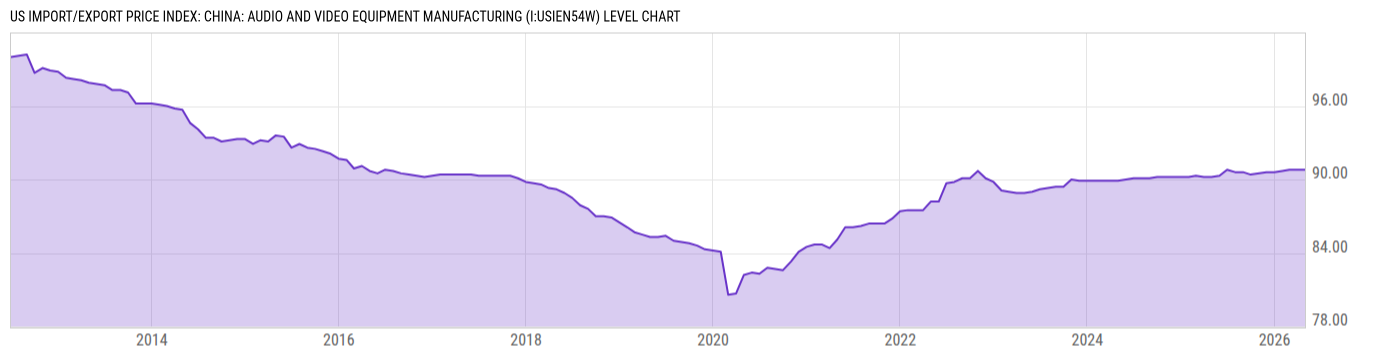
US Import/Export Price Index: China: Audio and Video Equipment Manufacturing (I:USIEN54W)
90.80 for Apr 2026
Level Chart
Basic Info
|
US Import/Export Price Index: China: Audio and Video Equipment Manufacturing is at a current level of 90.80, unchanged from 90.80 last month and up from 90.20 one year ago. This is a change of 0.00% from last month and 0.67% from one year ago. |
| Report | Import/Export Price Index |
| Category | International Transactions |
| Region | United States |
| Source | Bureau of Labor Statistics |
Stats
| Last Value | 90.80 |
| Latest Period | Apr 2026 |
| Last Updated | May 14 2026, 10:02 EDT |
| Next Release | Jun 16 2026, 10:00 EDT |
| Average Growth Rate | -0.71% |
| Value from Last Month | 90.80 |
| Change from Last Month | 0.00% |
| Value from 1 Year Ago | 90.20 |
| Change from 1 Year Ago | 0.67% |
| Frequency | Monthly |
| Unit | Index 2003=100 |
| Adjustment | Not Seasonally Adjusted |
| Download Source File |
Historical Data
| Date | Value |
|---|---|
| April 30, 2026 | 90.80 |
| March 31, 2026 | 90.80 |
| February 28, 2026 | 90.80 |
| January 31, 2026 | 90.70 |
| December 31, 2025 | 90.60 |
| November 30, 2025 | 90.60 |
| October 31, 2025 | |
| September 30, 2025 | 90.40 |
| August 31, 2025 | 90.60 |
| July 31, 2025 | 90.60 |
| June 30, 2025 | 90.80 |
| May 31, 2025 | 90.30 |
| April 30, 2025 | 90.20 |
| March 31, 2025 | 90.20 |
| February 28, 2025 | 90.30 |
| January 31, 2025 | 90.20 |
| December 31, 2024 | 90.20 |
| November 30, 2024 | 90.20 |
| October 31, 2024 | 90.20 |
| September 30, 2024 | 90.20 |
| August 31, 2024 | 90.10 |
| July 31, 2024 | 90.10 |
| June 30, 2024 | 90.10 |
| May 31, 2024 | 90.00 |
| April 30, 2024 | 89.90 |
| Date | Value |
|---|---|
| March 31, 2024 | 89.90 |
| February 29, 2024 | 89.90 |
| January 31, 2024 | 89.90 |
| December 31, 2023 | 89.90 |
| November 30, 2023 | 89.90 |
| October 31, 2023 | 90.00 |
| September 30, 2023 | 89.40 |
| August 31, 2023 | 89.40 |
| July 31, 2023 | 89.30 |
| June 30, 2023 | 89.20 |
| May 31, 2023 | 89.00 |
| April 30, 2023 | 88.90 |
| March 31, 2023 | 88.90 |
| February 28, 2023 | 89.00 |
| January 31, 2023 | 89.10 |
| December 31, 2022 | 89.80 |
| November 30, 2022 | 90.10 |
| October 31, 2022 | 90.70 |
| September 30, 2022 | 90.10 |
| August 31, 2022 | 90.10 |
| July 31, 2022 | 89.80 |
| June 30, 2022 | 89.70 |
| May 31, 2022 | 88.20 |
| April 30, 2022 | 88.20 |
| March 31, 2022 | 87.50 |
News
Headline
Time (ET)
05/22 07:41
05/13 17:00
05/13 15:57
Basic Info
|
US Import/Export Price Index: China: Audio and Video Equipment Manufacturing is at a current level of 90.80, unchanged from 90.80 last month and up from 90.20 one year ago. This is a change of 0.00% from last month and 0.67% from one year ago. |
| Report | Import/Export Price Index |
| Category | International Transactions |
| Region | United States |
| Source | Bureau of Labor Statistics |
Stats
| Last Value | 90.80 |
| Latest Period | Apr 2026 |
| Last Updated | May 14 2026, 10:02 EDT |
| Next Release | Jun 16 2026, 10:00 EDT |
| Average Growth Rate | -0.71% |
| Value from Last Month | 90.80 |
| Change from Last Month | 0.00% |
| Value from 1 Year Ago | 90.20 |
| Change from 1 Year Ago | 0.67% |
| Frequency | Monthly |
| Unit | Index 2003=100 |
| Adjustment | Not Seasonally Adjusted |
| Download Source File |