

US Housing Completed (I:USHC)
1.392M for Jun 2026
Level Chart
Basic Info
|
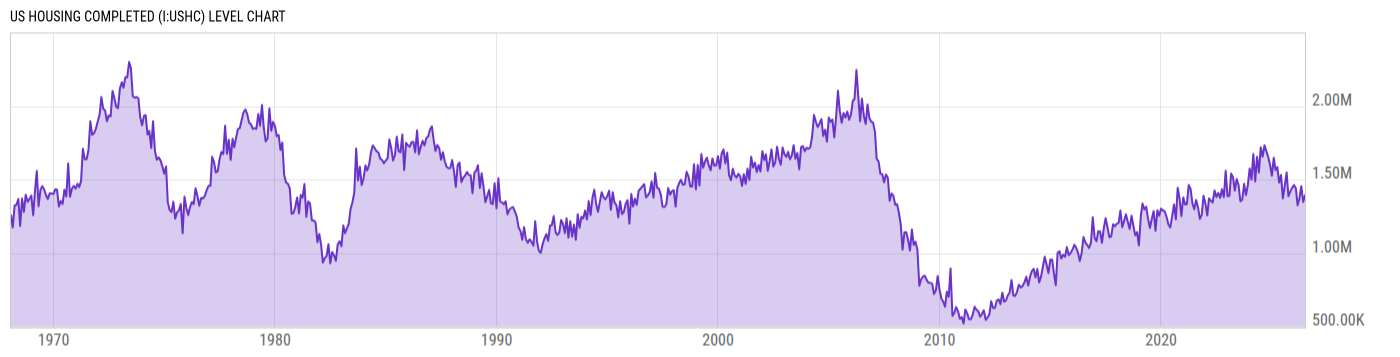
US Housing Completed is at a current level of 1.392M, up from 1.347M last month and up from 1.372M one year ago. This is a change of 3.34% from last month and 1.46% from one year ago. |
| Report | New Residential Construction |
| Category | Construction |
| Region | United States |
| Source | Census Bureau |
Stats
| Last Value | 1.392M |
| Latest Period | Jun 2026 |
| Last Updated | Jul 17 2026, 08:33 EDT |
| Next Release | Aug 18 2026, 08:30 EDT |
| Average Growth Rate | 2.84% |
| Value from Last Month | 1.347M |
| Change from Last Month | 3.34% |
| Value from 1 Year Ago | 1.372M |
| Change from 1 Year Ago | 1.46% |
| Frequency | Monthly |
| Adjustment | Seasonally Adjusted Annual Rate |
| Download Source File |
Historical Data
| Date | Value |
|---|---|
| June 30, 2026 | 1.392M |
| May 31, 2026 | 1.347M |
| April 30, 2026 | 1.454M |
| March 31, 2026 | 1.373M |
| February 28, 2026 | 1.324M |
| January 31, 2026 | 1.439M |
| December 31, 2025 | 1.463M |
| November 30, 2025 | 1.443M |
| October 31, 2025 | 1.419M |
| September 30, 2025 | 1.386M |
| August 31, 2025 | 1.548M |
| July 31, 2025 | 1.456M |
| June 30, 2025 | 1.372M |
| May 31, 2025 | 1.53M |
| April 30, 2025 | 1.479M |
| March 31, 2025 | 1.584M |
| February 28, 2025 | 1.565M |
| January 31, 2025 | 1.648M |
| December 31, 2024 | 1.526M |
| November 30, 2024 | 1.602M |
| October 31, 2024 | 1.653M |
| September 30, 2024 | 1.695M |
| August 31, 2024 | 1.733M |
| July 31, 2024 | 1.654M |
| June 30, 2024 | 1.719M |
| Date | Value |
|---|---|
| May 31, 2024 | 1.548M |
| April 30, 2024 | 1.655M |
| March 31, 2024 | 1.487M |
| February 29, 2024 | 1.674M |
| January 31, 2024 | 1.50M |
| December 31, 2023 | 1.575M |
| November 30, 2023 | 1.46M |
| October 31, 2023 | 1.394M |
| September 30, 2023 | 1.471M |
| August 31, 2023 | 1.363M |
| July 31, 2023 | 1.352M |
| June 30, 2023 | 1.464M |
| May 31, 2023 | 1.503M |
| April 30, 2023 | 1.425M |
| March 31, 2023 | 1.516M |
| February 28, 2023 | 1.54M |
| January 31, 2023 | 1.389M |
| December 31, 2022 | 1.386M |
| November 30, 2022 | 1.559M |
| October 31, 2022 | 1.379M |
| September 30, 2022 | 1.434M |
| August 31, 2022 | 1.375M |
| July 31, 2022 | 1.409M |
| June 30, 2022 | 1.381M |
| May 31, 2022 | 1.425M |
News
Headline
Time (ET)
07/16 12:53
07/16 08:37
06/30 12:33
Basic Info
|
US Housing Completed is at a current level of 1.392M, up from 1.347M last month and up from 1.372M one year ago. This is a change of 3.34% from last month and 1.46% from one year ago. |
| Report | New Residential Construction |
| Category | Construction |
| Region | United States |
| Source | Census Bureau |
Stats
| Last Value | 1.392M |
| Latest Period | Jun 2026 |
| Last Updated | Jul 17 2026, 08:33 EDT |
| Next Release | Aug 18 2026, 08:30 EDT |
| Average Growth Rate | 2.84% |
| Value from Last Month | 1.347M |
| Change from Last Month | 3.34% |
| Value from 1 Year Ago | 1.372M |
| Change from 1 Year Ago | 1.46% |
| Frequency | Monthly |
| Adjustment | Seasonally Adjusted Annual Rate |
| Download Source File |