

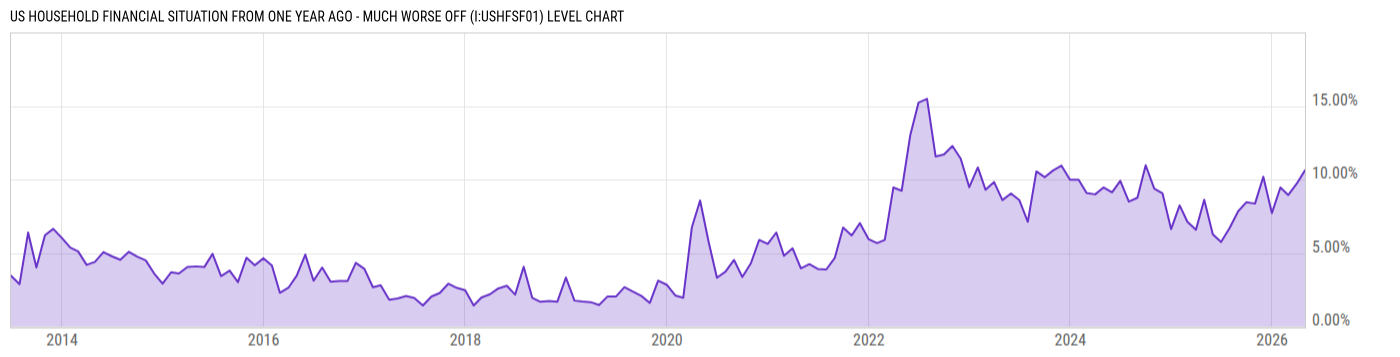
US Household Financial Situation From One Year Ago - Much Worse Off (I:USHFSF01)
10.63% for Apr 2026
Level Chart
Basic Info
|
US Household Financial Situation From One Year Ago - Much Worse Off is at 10.63%, compared to 9.72% last month and 8.63% last year. This is higher than the long term average of 5.58%. |
| Report | Survey of Consumer Expectations |
| Category | Consumer & Household Statistics |
| Region | United States |
| Source | Federal Reserve Bank of New York |
Stats
| Last Value | 10.63% |
| Latest Period | Apr 2026 |
| Last Updated | May 7 2026, 11:03 EDT |
| Next Release | Jun 8 2026, 09:00 EDT (E) |
| Long Term Average | 5.58% |
| Average Growth Rate | 55.86% |
| Value from Last Month | 9.72% |
| Change from Last Month | 9.39% |
| Value from 1 Year Ago | 8.63% |
| Change from 1 Year Ago | 23.20% |
| Frequency | Monthly |
| Unit | Percent |
| Adjustment | N/A |
| Download Source File | |
| Notes | Financially worse or better off than year ago |
Historical Data
| Date | Value |
|---|---|
| April 30, 2026 | 10.63% |
| March 31, 2026 | 9.72% |
| February 28, 2026 | 8.94% |
| January 31, 2026 | 9.46% |
| December 31, 2025 | 7.71% |
| November 30, 2025 | 10.19% |
| October 31, 2025 | 8.36% |
| September 30, 2025 | 8.46% |
| August 31, 2025 | 7.84% |
| July 31, 2025 | 6.71% |
| June 30, 2025 | 5.75% |
| May 31, 2025 | 6.28% |
| April 30, 2025 | 8.63% |
| March 31, 2025 | 6.58% |
| February 28, 2025 | 7.12% |
| January 31, 2025 | 8.24% |
| December 31, 2024 | 6.62% |
| November 30, 2024 | 9.05% |
| October 31, 2024 | 9.38% |
| September 30, 2024 | 10.97% |
| August 31, 2024 | 8.76% |
| July 31, 2024 | 8.49% |
| June 30, 2024 | 9.91% |
| May 31, 2024 | 9.13% |
| April 30, 2024 | 9.46% |
| Date | Value |
|---|---|
| March 31, 2024 | 8.99% |
| February 29, 2024 | 9.08% |
| January 31, 2024 | 9.98% |
| December 31, 2023 | 9.99% |
| November 30, 2023 | 10.94% |
| October 31, 2023 | 10.62% |
| September 30, 2023 | 10.16% |
| August 31, 2023 | 10.55% |
| July 31, 2023 | 7.12% |
| June 30, 2023 | 8.61% |
| May 31, 2023 | 9.05% |
| April 30, 2023 | 8.60% |
| March 31, 2023 | 9.82% |
| February 28, 2023 | 9.30% |
| January 31, 2023 | 10.82% |
| December 31, 2022 | 9.48% |
| November 30, 2022 | 11.41% |
| October 31, 2022 | 12.28% |
| September 30, 2022 | 11.70% |
| August 31, 2022 | 11.57% |
| July 31, 2022 | 15.49% |
| June 30, 2022 | 15.22% |
| May 31, 2022 | 12.99% |
| April 30, 2022 | 9.23% |
| March 31, 2022 | 9.45% |
News
Headline
Time (ET)
05/22 09:11
05/11 07:48
04/24 14:16
Basic Info
|
US Household Financial Situation From One Year Ago - Much Worse Off is at 10.63%, compared to 9.72% last month and 8.63% last year. This is higher than the long term average of 5.58%. |
| Report | Survey of Consumer Expectations |
| Category | Consumer & Household Statistics |
| Region | United States |
| Source | Federal Reserve Bank of New York |
Stats
| Last Value | 10.63% |
| Latest Period | Apr 2026 |
| Last Updated | May 7 2026, 11:03 EDT |
| Next Release | Jun 8 2026, 09:00 EDT (E) |
| Long Term Average | 5.58% |
| Average Growth Rate | 55.86% |
| Value from Last Month | 9.72% |
| Change from Last Month | 9.39% |
| Value from 1 Year Ago | 8.63% |
| Change from 1 Year Ago | 23.20% |
| Frequency | Monthly |
| Unit | Percent |
| Adjustment | N/A |
| Download Source File | |
| Notes | Financially worse or better off than year ago |