

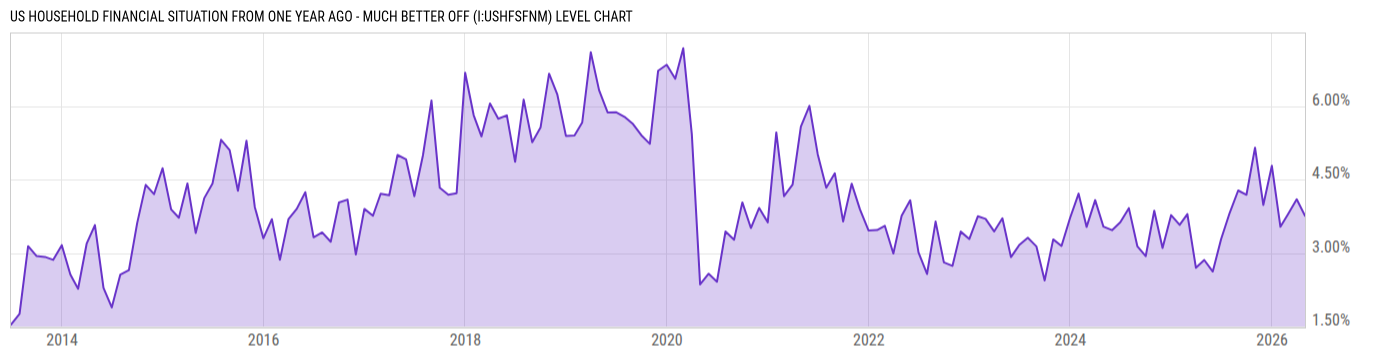
US Household Financial Situation From One Year Ago - Much Better Off (I:USHFSFNM)
3.76% for Apr 2026
Level Chart
Basic Info
|
US Household Financial Situation From One Year Ago - Much Better Off is at 3.76%, compared to 4.10% last month and 2.86% last year. This is lower than the long term average of 4.09%. |
| Report | Survey of Consumer Expectations |
| Category | Consumer & Household Statistics |
| Region | United States |
| Source | Federal Reserve Bank of New York |
Stats
| Last Value | 3.76% |
| Latest Period | Apr 2026 |
| Last Updated | May 7 2026, 11:03 EDT |
| Next Release | Jun 8 2026, 09:00 EDT (E) |
| Long Term Average | 4.09% |
| Average Growth Rate | 29.15% |
| Value from Last Month | 4.10% |
| Change from Last Month | -8.24% |
| Value from 1 Year Ago | 2.86% |
| Change from 1 Year Ago | 31.54% |
| Frequency | Monthly |
| Unit | Percent |
| Adjustment | N/A |
| Download Source File | |
| Notes | Financially worse or better off than year ago |
Historical Data
| Date | Value |
|---|---|
| April 30, 2026 | 3.76% |
| March 31, 2026 | 4.10% |
| February 28, 2026 | 3.80% |
| January 31, 2026 | 3.53% |
| December 31, 2025 | 4.78% |
| November 30, 2025 | 3.98% |
| October 31, 2025 | 5.15% |
| September 30, 2025 | 4.19% |
| August 31, 2025 | 4.28% |
| July 31, 2025 | 3.82% |
| June 30, 2025 | 3.28% |
| May 31, 2025 | 2.62% |
| April 30, 2025 | 2.86% |
| March 31, 2025 | 2.70% |
| February 28, 2025 | 3.79% |
| January 31, 2025 | 3.57% |
| December 31, 2024 | 3.77% |
| November 30, 2024 | 3.10% |
| October 31, 2024 | 3.86% |
| September 30, 2024 | 2.93% |
| August 31, 2024 | 3.13% |
| July 31, 2024 | 3.92% |
| June 30, 2024 | 3.63% |
| May 31, 2024 | 3.47% |
| April 30, 2024 | 3.54% |
| Date | Value |
|---|---|
| March 31, 2024 | 4.08% |
| February 29, 2024 | 3.53% |
| January 31, 2024 | 4.21% |
| December 31, 2023 | 3.71% |
| November 30, 2023 | 3.14% |
| October 31, 2023 | 3.28% |
| September 30, 2023 | 2.44% |
| August 31, 2023 | 3.14% |
| July 31, 2023 | 3.31% |
| June 30, 2023 | 3.16% |
| May 31, 2023 | 2.92% |
| April 30, 2023 | 3.71% |
| March 31, 2023 | 3.44% |
| February 28, 2023 | 3.70% |
| January 31, 2023 | 3.75% |
| December 31, 2022 | 3.28% |
| November 30, 2022 | 3.44% |
| October 31, 2022 | 2.74% |
| September 30, 2022 | 2.81% |
| August 31, 2022 | 3.64% |
| July 31, 2022 | 2.57% |
| June 30, 2022 | 3.01% |
| May 31, 2022 | 4.08% |
| April 30, 2022 | 3.76% |
| March 31, 2022 | 2.99% |
News
Headline
Time (ET)
04/24 14:16
04/20 07:46
Basic Info
|
US Household Financial Situation From One Year Ago - Much Better Off is at 3.76%, compared to 4.10% last month and 2.86% last year. This is lower than the long term average of 4.09%. |
| Report | Survey of Consumer Expectations |
| Category | Consumer & Household Statistics |
| Region | United States |
| Source | Federal Reserve Bank of New York |
Stats
| Last Value | 3.76% |
| Latest Period | Apr 2026 |
| Last Updated | May 7 2026, 11:03 EDT |
| Next Release | Jun 8 2026, 09:00 EDT (E) |
| Long Term Average | 4.09% |
| Average Growth Rate | 29.15% |
| Value from Last Month | 4.10% |
| Change from Last Month | -8.24% |
| Value from 1 Year Ago | 2.86% |
| Change from 1 Year Ago | 31.54% |
| Frequency | Monthly |
| Unit | Percent |
| Adjustment | N/A |
| Download Source File | |
| Notes | Financially worse or better off than year ago |