

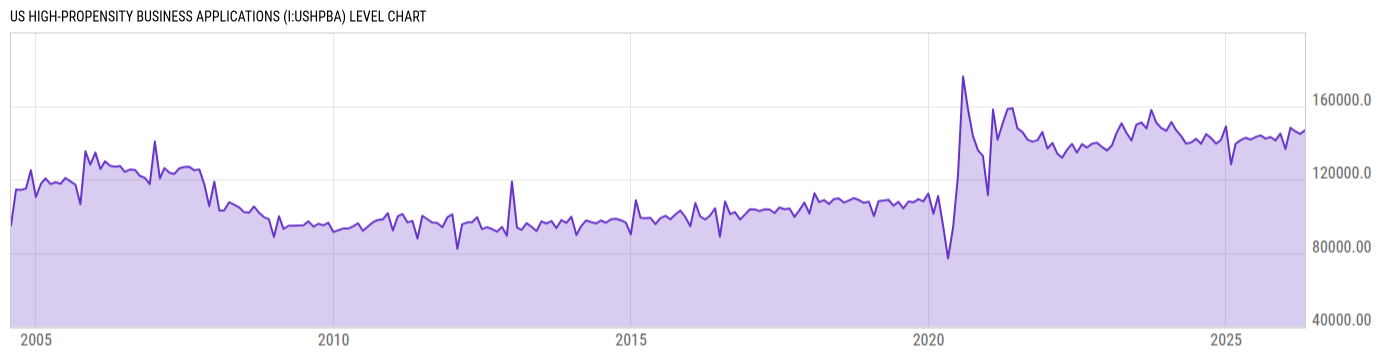
US High-Propensity Business Applications (I:USHPBA)
146782.0 for Apr 2026
Level Chart
Basic Info
|
US High-Propensity Business Applications is at a current level of 146782.0, up from 144821.0 last month and up from 142697.0 one year ago. This is a change of 1.35% from last month and 2.86% from one year ago. |
| Region | United States |
| Source | Census Bureau |
Stats
| Last Value | 146782.0 |
| Latest Period | Apr 2026 |
| Last Updated | May 13 2026, 10:05 EDT |
| Next Release | Jun 10 2026, 10:00 EDT |
| Average Growth Rate | 5.30% |
| Value from Last Month | 144821.0 |
| Change from Last Month | 1.35% |
| Value from 1 Year Ago | 142697.0 |
| Change from 1 Year Ago | 2.86% |
| Frequency | Monthly |
| Adjustment | Seasonally Adjusted |
Historical Data
| Date | Value |
|---|---|
| April 30, 2026 | 146782.0 |
| March 31, 2026 | 144821.0 |
| February 28, 2026 | 146252.0 |
| January 31, 2026 | 148127.0 |
| December 31, 2025 | 136578.0 |
| November 30, 2025 | 145007.0 |
| October 31, 2025 | 141266.0 |
| September 30, 2025 | 143116.0 |
| August 31, 2025 | 142221.0 |
| July 31, 2025 | 143991.0 |
| June 30, 2025 | 143107.0 |
| May 31, 2025 | 141759.0 |
| April 30, 2025 | 142697.0 |
| March 31, 2025 | 141441.0 |
| February 28, 2025 | 139440.0 |
| January 31, 2025 | 128338.0 |
| December 31, 2024 | 148917.0 |
| November 30, 2024 | 141489.0 |
| October 31, 2024 | 139532.0 |
| September 30, 2024 | 142589.0 |
| August 31, 2024 | 144689.0 |
| July 31, 2024 | 139439.0 |
| June 30, 2024 | 142131.0 |
| May 31, 2024 | 140171.0 |
| April 30, 2024 | 139518.0 |
| Date | Value |
|---|---|
| March 31, 2024 | 143583.0 |
| February 29, 2024 | 146859.0 |
| January 31, 2024 | 151258.0 |
| December 31, 2023 | 146529.0 |
| November 30, 2023 | 147978.0 |
| October 31, 2023 | 150865.0 |
| September 30, 2023 | 157826.0 |
| August 31, 2023 | 147789.0 |
| July 31, 2023 | 151021.0 |
| June 30, 2023 | 149900.0 |
| May 31, 2023 | 141216.0 |
| April 30, 2023 | 145446.0 |
| March 31, 2023 | 150569.0 |
| February 28, 2023 | 145233.0 |
| January 31, 2023 | 138547.0 |
| December 31, 2022 | 135829.0 |
| November 30, 2022 | 137774.0 |
| October 31, 2022 | 140057.0 |
| September 30, 2022 | 139425.0 |
| August 31, 2022 | 137380.0 |
| July 31, 2022 | 139237.0 |
| June 30, 2022 | 134684.0 |
| May 31, 2022 | 139365.0 |
| April 30, 2022 | 136127.0 |
| March 31, 2022 | 131877.0 |
News
Headline
Time (ET)
05/21 07:19
04/23 08:36
Basic Info
|
US High-Propensity Business Applications is at a current level of 146782.0, up from 144821.0 last month and up from 142697.0 one year ago. This is a change of 1.35% from last month and 2.86% from one year ago. |
| Region | United States |
| Source | Census Bureau |
Stats
| Last Value | 146782.0 |
| Latest Period | Apr 2026 |
| Last Updated | May 13 2026, 10:05 EDT |
| Next Release | Jun 10 2026, 10:00 EDT |
| Average Growth Rate | 5.30% |
| Value from Last Month | 144821.0 |
| Change from Last Month | 1.35% |
| Value from 1 Year Ago | 142697.0 |
| Change from 1 Year Ago | 2.86% |
| Frequency | Monthly |
| Adjustment | Seasonally Adjusted |