

US Export Prices MoM (I:USEIACUMP)
3.30% for Apr 2026
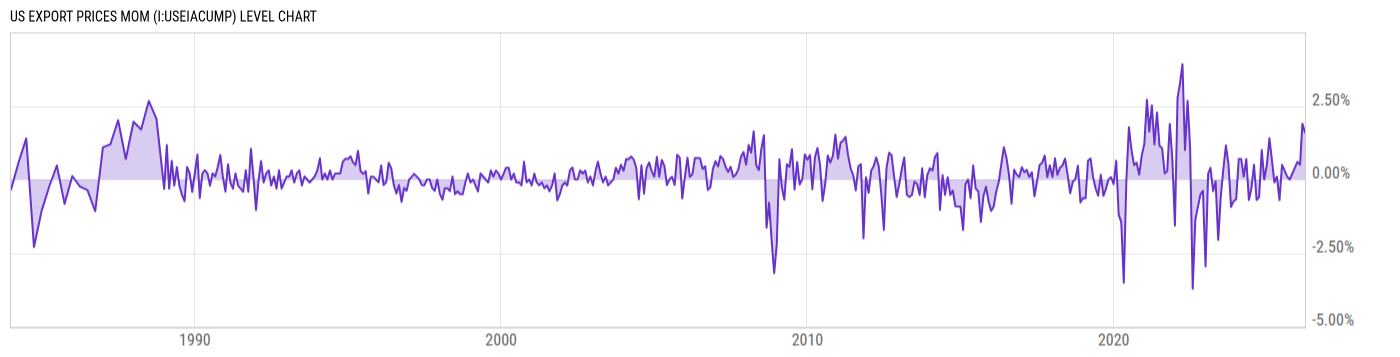
Level Chart
Basic Info
|
US Export Prices MoM is at 3.30%, compared to 1.50% last month and 0.10% last year. This is higher than the long term average of 0.14%. |
|
Month over month change of US Export Price Index: All Commodities. |
| Report | Import/Export Price Index |
| Category | International Transactions |
| Region | United States |
| Source | Bureau of Labor Statistics |
Stats
| Last Value | 3.30% |
| Latest Period | Apr 2026 |
| Last Updated | May 14 2026, 10:05 EDT |
| Next Release | Jun 16 2026, 10:00 EDT |
| Long Term Average | 0.14% |
| Average Growth Rate | -725.5% |
| Value from Last Month | 1.50% |
| Change from Last Month | 120.0% |
| Value from 1 Year Ago | 0.10% |
| Change from 1 Year Ago | 3.20K% |
| Frequency | Monthly |
| Unit | Percent |
| Adjustment | Not Seasonally Adjusted |
| Download Source File |
Historical Data
| Date | Value |
|---|---|
| April 30, 2026 | 3.30% |
| March 31, 2026 | 1.50% |
| February 28, 2026 | 1.90% |
| January 31, 2026 | 0.50% |
| December 31, 2025 | 0.60% |
| November 30, 2025 | |
| October 31, 2025 | |
| September 30, 2025 | 0.00% |
| August 31, 2025 | 0.10% |
| July 31, 2025 | 0.30% |
| June 30, 2025 | 0.50% |
| May 31, 2025 | -0.70% |
| April 30, 2025 | 0.10% |
| March 31, 2025 | -0.10% |
| February 28, 2025 | 0.70% |
| January 31, 2025 | 1.40% |
| December 31, 2024 | 0.50% |
| November 30, 2024 | 0.00% |
| October 31, 2024 | 1.00% |
| September 30, 2024 | -0.60% |
| August 31, 2024 | -0.70% |
| July 31, 2024 | 0.50% |
| June 30, 2024 | -0.30% |
| May 31, 2024 | -0.70% |
| April 30, 2024 | 0.70% |
| Date | Value |
|---|---|
| March 31, 2024 | 0.10% |
| February 29, 2024 | 0.70% |
| January 31, 2024 | 0.70% |
| December 31, 2023 | -0.68% |
| November 30, 2023 | -0.74% |
| October 31, 2023 | -0.93% |
| September 30, 2023 | 0.54% |
| August 31, 2023 | 1.15% |
| July 31, 2023 | 0.34% |
| June 30, 2023 | -0.61% |
| May 31, 2023 | -2.05% |
| April 30, 2023 | -0.07% |
| March 31, 2023 | -0.40% |
| February 28, 2023 | 0.40% |
| January 31, 2023 | 0.20% |
| December 31, 2022 | -2.96% |
| November 30, 2022 | -0.38% |
| October 31, 2022 | -0.51% |
| September 30, 2022 | -0.95% |
| August 31, 2022 | -1.37% |
| July 31, 2022 | -3.72% |
| June 30, 2022 | 1.09% |
| May 31, 2022 | 2.68% |
| April 30, 2022 | 1.01% |
| March 31, 2022 | 3.92% |
News
Headline
Time (ET)
05/22 07:41
05/13 15:57
Basic Info
|
US Export Prices MoM is at 3.30%, compared to 1.50% last month and 0.10% last year. This is higher than the long term average of 0.14%. |
|
Month over month change of US Export Price Index: All Commodities. |
| Report | Import/Export Price Index |
| Category | International Transactions |
| Region | United States |
| Source | Bureau of Labor Statistics |
Stats
| Last Value | 3.30% |
| Latest Period | Apr 2026 |
| Last Updated | May 14 2026, 10:05 EDT |
| Next Release | Jun 16 2026, 10:00 EDT |
| Long Term Average | 0.14% |
| Average Growth Rate | -725.5% |
| Value from Last Month | 1.50% |
| Change from Last Month | 120.0% |
| Value from 1 Year Ago | 0.10% |
| Change from 1 Year Ago | 3.20K% |
| Frequency | Monthly |
| Unit | Percent |
| Adjustment | Not Seasonally Adjusted |
| Download Source File |