

US Expectations of Higher Unemployment (I:USEHU)
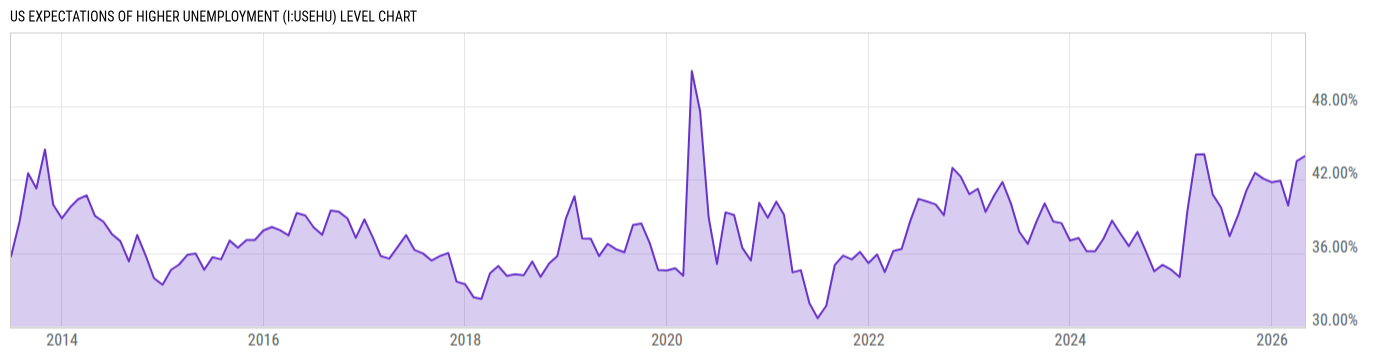
43.91% for Apr 2026
Level Chart
Basic Info
|
US Expectations of Higher Unemployment is at 43.91%, compared to 43.50% last month and 44.06% last year. This is higher than the long term average of 37.62%. |
| Report | Survey of Consumer Expectations |
| Category | Consumer & Household Statistics |
| Region | United States |
| Source | Federal Reserve Bank of New York |
Stats
| Last Value | 43.91% |
| Latest Period | Apr 2026 |
| Last Updated | May 7 2026, 11:03 EDT |
| Next Release | Jun 8 2026, 09:00 EDT (E) |
| Long Term Average | 37.62% |
| Average Growth Rate | 3.69% |
| Value from Last Month | 43.50% |
| Change from Last Month | 0.94% |
| Value from 1 Year Ago | 44.06% |
| Change from 1 Year Ago | -0.34% |
| Frequency | Monthly |
| Unit | Percent |
| Adjustment | N/A |
| Download Source File | |
| Notes | Mean probability that the U.S. unemployment rate will be higher one year from now. |
Historical Data
| Date | Value |
|---|---|
| April 30, 2026 | 43.91% |
| March 31, 2026 | 43.50% |
| February 28, 2026 | 39.88% |
| January 31, 2026 | 41.89% |
| December 31, 2025 | 41.77% |
| November 30, 2025 | 42.07% |
| October 31, 2025 | 42.54% |
| September 30, 2025 | 41.11% |
| August 31, 2025 | 39.12% |
| July 31, 2025 | 37.37% |
| June 30, 2025 | 39.71% |
| May 31, 2025 | 40.76% |
| April 30, 2025 | 44.06% |
| March 31, 2025 | 44.04% |
| February 28, 2025 | 39.44% |
| January 31, 2025 | 34.03% |
| December 31, 2024 | 34.63% |
| November 30, 2024 | 35.03% |
| October 31, 2024 | 34.51% |
| September 30, 2024 | 36.18% |
| August 31, 2024 | 37.72% |
| July 31, 2024 | 36.56% |
| June 30, 2024 | 37.59% |
| May 31, 2024 | 38.65% |
| April 30, 2024 | 37.17% |
| Date | Value |
|---|---|
| March 31, 2024 | 36.15% |
| February 29, 2024 | 36.14% |
| January 31, 2024 | 37.22% |
| December 31, 2023 | 37.02% |
| November 30, 2023 | 38.44% |
| October 31, 2023 | 38.58% |
| September 30, 2023 | 40.06% |
| August 31, 2023 | 38.54% |
| July 31, 2023 | 36.74% |
| June 30, 2023 | 37.73% |
| May 31, 2023 | 40.03% |
| April 30, 2023 | 41.80% |
| March 31, 2023 | 40.69% |
| February 28, 2023 | 39.36% |
| January 31, 2023 | 41.24% |
| December 31, 2022 | 40.81% |
| November 30, 2022 | 42.24% |
| October 31, 2022 | 42.95% |
| September 30, 2022 | 39.09% |
| August 31, 2022 | 39.97% |
| July 31, 2022 | 40.21% |
| June 30, 2022 | 40.42% |
| May 31, 2022 | 38.60% |
| April 30, 2022 | 36.33% |
| March 31, 2022 | 36.17% |
News
Headline
Time (ET)
04/24 14:16
04/20 07:46
Basic Info
|
US Expectations of Higher Unemployment is at 43.91%, compared to 43.50% last month and 44.06% last year. This is higher than the long term average of 37.62%. |
| Report | Survey of Consumer Expectations |
| Category | Consumer & Household Statistics |
| Region | United States |
| Source | Federal Reserve Bank of New York |
Stats
| Last Value | 43.91% |
| Latest Period | Apr 2026 |
| Last Updated | May 7 2026, 11:03 EDT |
| Next Release | Jun 8 2026, 09:00 EDT (E) |
| Long Term Average | 37.62% |
| Average Growth Rate | 3.69% |
| Value from Last Month | 43.50% |
| Change from Last Month | 0.94% |
| Value from 1 Year Ago | 44.06% |
| Change from 1 Year Ago | -0.34% |
| Frequency | Monthly |
| Unit | Percent |
| Adjustment | N/A |
| Download Source File | |
| Notes | Mean probability that the U.S. unemployment rate will be higher one year from now. |