

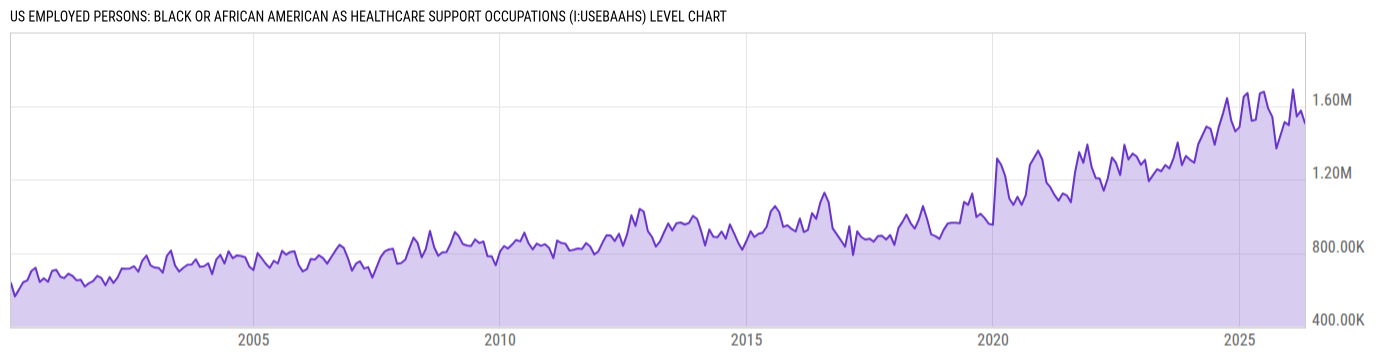
US Employed Persons: Black or African American as Healthcare Support Occupations (I:USEBAAHS)
1.506M for Apr 2026
Level Chart
Basic Info
|
US Employed Persons: Black or African American as Healthcare Support Occupations is at a current level of 1.506M, down from 1.575M last month and down from 1.525M one year ago. This is a change of -4.38% from last month and -1.25% from one year ago. |
| Report | Employment Situation |
| Categories | Employment , Hours and Wages |
| Region | United States |
| Source | Bureau of Labor Statistics |
Stats
| Last Value | 1.506M |
| Latest Period | Apr 2026 |
| Last Updated | May 8 2026, 10:51 EDT |
| Next Release | Jun 5 2026, 08:30 EDT |
| Average Growth Rate | 5.14% |
| Value from Last Month | 1.575M |
| Change from Last Month | -4.38% |
| Value from 1 Year Ago | 1.525M |
| Change from 1 Year Ago | -1.25% |
| Frequency | Monthly |
| Adjustment | Not Seasonally Adjusted |
| Download Source File |
Historical Data
| Date | Value |
|---|---|
| April 30, 2026 | 1.506M |
| March 31, 2026 | 1.575M |
| February 28, 2026 | 1.543M |
| January 31, 2026 | 1.69M |
| December 31, 2025 | 1.496M |
| November 30, 2025 | 1.513M |
| October 31, 2025 | |
| September 30, 2025 | 1.369M |
| August 31, 2025 | 1.541M |
| July 31, 2025 | 1.587M |
| June 30, 2025 | 1.678M |
| May 31, 2025 | 1.669M |
| April 30, 2025 | 1.525M |
| March 31, 2025 | 1.52M |
| February 28, 2025 | 1.671M |
| January 31, 2025 | 1.65M |
| December 31, 2024 | 1.485M |
| November 30, 2024 | 1.462M |
| October 31, 2024 | 1.52M |
| September 30, 2024 | 1.643M |
| August 31, 2024 | 1.56M |
| July 31, 2024 | 1.488M |
| June 30, 2024 | 1.389M |
| May 31, 2024 | 1.475M |
| April 30, 2024 | 1.488M |
| Date | Value |
|---|---|
| March 31, 2024 | 1.441M |
| February 29, 2024 | 1.392M |
| January 31, 2024 | 1.292M |
| December 31, 2023 | 1.307M |
| November 30, 2023 | 1.328M |
| October 31, 2023 | 1.278M |
| September 30, 2023 | 1.401M |
| August 31, 2023 | 1.318M |
| July 31, 2023 | 1.26M |
| June 30, 2023 | 1.279M |
| May 31, 2023 | 1.245M |
| April 30, 2023 | 1.256M |
| March 31, 2023 | 1.224M |
| February 28, 2023 | 1.191M |
| January 31, 2023 | 1.307M |
| December 31, 2022 | 1.28M |
| November 30, 2022 | 1.325M |
| October 31, 2022 | 1.341M |
| September 30, 2022 | 1.309M |
| August 31, 2022 | 1.389M |
| July 31, 2022 | 1.224M |
| June 30, 2022 | 1.29M |
| May 31, 2022 | 1.32M |
| April 30, 2022 | 1.207M |
| March 31, 2022 | 1.139M |
News
Headline
Time (ET)
05/25 09:56
05/08 07:44
Basic Info
|
US Employed Persons: Black or African American as Healthcare Support Occupations is at a current level of 1.506M, down from 1.575M last month and down from 1.525M one year ago. This is a change of -4.38% from last month and -1.25% from one year ago. |
| Report | Employment Situation |
| Categories | Employment , Hours and Wages |
| Region | United States |
| Source | Bureau of Labor Statistics |
Stats
| Last Value | 1.506M |
| Latest Period | Apr 2026 |
| Last Updated | May 8 2026, 10:51 EDT |
| Next Release | Jun 5 2026, 08:30 EDT |
| Average Growth Rate | 5.14% |
| Value from Last Month | 1.575M |
| Change from Last Month | -4.38% |
| Value from 1 Year Ago | 1.525M |
| Change from 1 Year Ago | -1.25% |
| Frequency | Monthly |
| Adjustment | Not Seasonally Adjusted |
| Download Source File |