

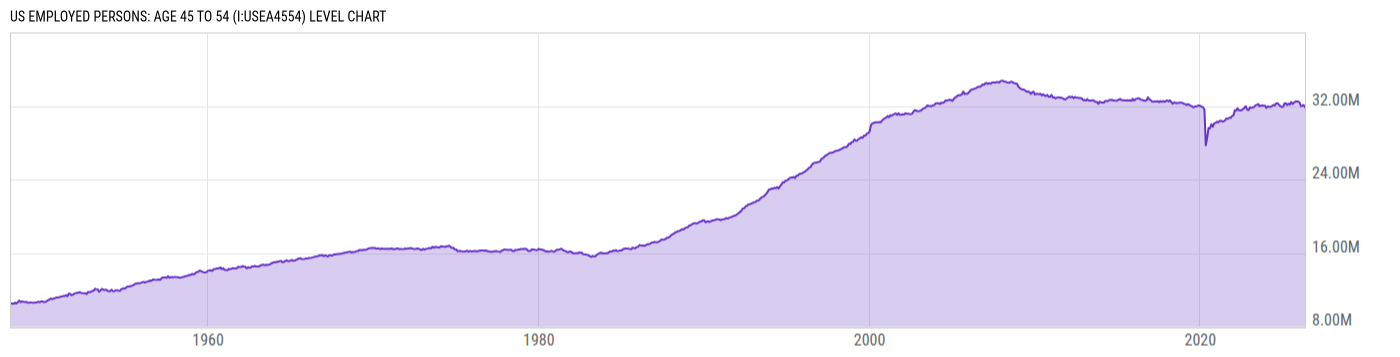
US Employed Persons: Age 45 to 54 (I:USEA4554)
31.86M for Apr 2026
Level Chart
Basic Info
|
US Employed Persons: Age 45 to 54 is at a current level of 31.86M, down from 32.12M last month and down from 32.25M one year ago. This is a change of -0.80% from last month and -1.22% from one year ago. |
| Report | Employment Situation |
| Categories | Employment , Hours and Wages |
| Region | United States |
| Source | Bureau of Labor Statistics |
Stats
| Last Value | 31.86M |
| Latest Period | Apr 2026 |
| Last Updated | May 8 2026, 08:42 EDT |
| Next Release | Jun 5 2026, 08:30 EDT |
| Average Growth Rate | 1.45% |
| Value from Last Month | 32.12M |
| Change from Last Month | -0.80% |
| Value from 1 Year Ago | 32.25M |
| Change from 1 Year Ago | -1.22% |
| Frequency | Monthly |
| Adjustment | Seasonally Adjusted |
| Download Source File |
Historical Data
| Date | Value |
|---|---|
| April 30, 2026 | 31.86M |
| March 31, 2026 | 32.12M |
| February 28, 2026 | 32.02M |
| January 31, 2026 | 31.99M |
| December 31, 2025 | 32.38M |
| November 30, 2025 | 32.49M |
| October 31, 2025 | |
| September 30, 2025 | 32.48M |
| August 31, 2025 | 32.38M |
| July 31, 2025 | 32.23M |
| June 30, 2025 | 32.42M |
| May 31, 2025 | 32.16M |
| April 30, 2025 | 32.25M |
| March 31, 2025 | 32.10M |
| February 28, 2025 | 32.30M |
| January 31, 2025 | 32.26M |
| December 31, 2024 | 31.91M |
| November 30, 2024 | 31.89M |
| October 31, 2024 | 31.99M |
| September 30, 2024 | 32.15M |
| August 31, 2024 | 32.30M |
| July 31, 2024 | 32.28M |
| June 30, 2024 | 32.06M |
| May 31, 2024 | 32.11M |
| April 30, 2024 | 32.00M |
| Date | Value |
|---|---|
| March 31, 2024 | 31.90M |
| February 29, 2024 | 31.92M |
| January 31, 2024 | 31.96M |
| December 31, 2023 | 31.80M |
| November 30, 2023 | 32.02M |
| October 31, 2023 | 32.03M |
| September 30, 2023 | 32.06M |
| August 31, 2023 | 32.04M |
| July 31, 2023 | 31.96M |
| June 30, 2023 | 32.22M |
| May 31, 2023 | 32.12M |
| April 30, 2023 | 32.07M |
| March 31, 2023 | 31.89M |
| February 28, 2023 | 31.84M |
| January 31, 2023 | 31.79M |
| December 31, 2022 | 31.86M |
| November 30, 2022 | 31.55M |
| October 31, 2022 | 31.59M |
| September 30, 2022 | 31.98M |
| August 31, 2022 | 31.81M |
| July 31, 2022 | 31.66M |
| June 30, 2022 | 31.56M |
| May 31, 2022 | 31.51M |
| April 30, 2022 | 31.56M |
| March 31, 2022 | 31.75M |
News
Headline
Time (ET)
05/08 07:44
Basic Info
|
US Employed Persons: Age 45 to 54 is at a current level of 31.86M, down from 32.12M last month and down from 32.25M one year ago. This is a change of -0.80% from last month and -1.22% from one year ago. |
| Report | Employment Situation |
| Categories | Employment , Hours and Wages |
| Region | United States |
| Source | Bureau of Labor Statistics |
Stats
| Last Value | 31.86M |
| Latest Period | Apr 2026 |
| Last Updated | May 8 2026, 08:42 EDT |
| Next Release | Jun 5 2026, 08:30 EDT |
| Average Growth Rate | 1.45% |
| Value from Last Month | 32.12M |
| Change from Last Month | -0.80% |
| Value from 1 Year Ago | 32.25M |
| Change from 1 Year Ago | -1.22% |
| Frequency | Monthly |
| Adjustment | Seasonally Adjusted |
| Download Source File |