

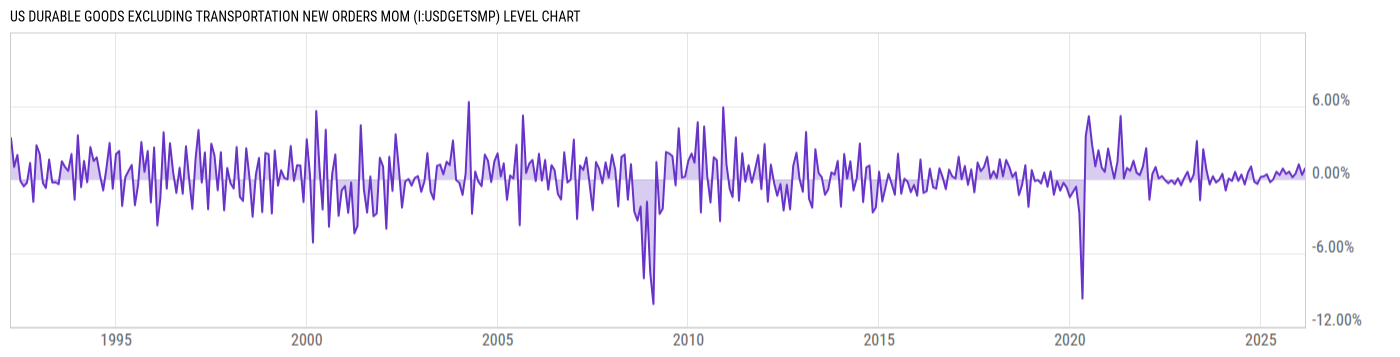
US Durable Goods Excluding Transportation New Orders MoM (I:USDGETSMP)
0.89% for Feb 2026
Level Chart
Basic Info
|
US Durable Goods Excluding Transportation New Orders MoM is at 0.89%, compared to 0.37% last month and 0.42% last year. This is higher than the long term average of 0.25%. |
| Report | Manufacturers' Shipments, Inventories, and Orders (M3) |
| Category | Manufacturing Business Statistics |
| Region | United States |
| Source | Census Bureau |
Stats
| Last Value | 0.89% |
| Latest Period | Feb 2026 |
| Last Updated | Apr 10 2026, 18:13 EDT |
| Next Release | May 28 2026, 10:00 EDT |
| Long Term Average | 0.25% |
| Average Growth Rate | -553.3% |
| Value from Last Month | 0.37% |
| Change from Last Month | 138.9% |
| Value from 1 Year Ago | 0.42% |
| Change from 1 Year Ago | 112.2% |
| Frequency | Monthly |
| Unit | Percent |
| Adjustment | Seasonally Adjusted |
| Download Source File |
Historical Data
| Date | Value |
|---|---|
| February 28, 2026 | 0.89% |
| January 31, 2026 | 0.37% |
| December 31, 2025 | 1.24% |
| November 30, 2025 | 0.47% |
| October 31, 2025 | 0.19% |
| September 30, 2025 | 0.64% |
| August 31, 2025 | 0.45% |
| July 31, 2025 | 0.90% |
| June 30, 2025 | 0.36% |
| May 31, 2025 | 0.64% |
| April 30, 2025 | 0.01% |
| March 31, 2025 | -0.22% |
| February 28, 2025 | 0.42% |
| January 31, 2025 | 0.26% |
| December 31, 2024 | 0.21% |
| November 30, 2024 | -0.36% |
| October 31, 2024 | -0.19% |
| September 30, 2024 | 1.07% |
| August 31, 2024 | 0.57% |
| July 31, 2024 | -0.41% |
| June 30, 2024 | 0.41% |
| May 31, 2024 | -0.11% |
| April 30, 2024 | 0.62% |
| March 31, 2024 | -0.11% |
| February 29, 2024 | 0.07% |
| Date | Value |
|---|---|
| January 31, 2024 | -0.89% |
| December 31, 2023 | 0.46% |
| November 30, 2023 | -0.03% |
| October 31, 2023 | -0.25% |
| September 30, 2023 | 0.27% |
| August 31, 2023 | -0.41% |
| July 31, 2023 | 0.75% |
| June 30, 2023 | 2.48% |
| May 31, 2023 | -1.69% |
| April 30, 2023 | 3.14% |
| March 31, 2023 | 0.41% |
| February 28, 2023 | -0.19% |
| January 31, 2023 | 0.63% |
| December 31, 2022 | 0.15% |
| November 30, 2022 | -0.48% |
| October 31, 2022 | 0.10% |
| September 30, 2022 | -0.38% |
| August 31, 2022 | -0.07% |
| July 31, 2022 | -0.30% |
| June 30, 2022 | -0.06% |
| May 31, 2022 | 0.28% |
| April 30, 2022 | 0.08% |
| March 31, 2022 | 1.02% |
| February 28, 2022 | 0.46% |
| January 31, 2022 | -1.64% |
News
Headline
Time (ET)
05/08 13:15
05/01 12:49
Basic Info
|
US Durable Goods Excluding Transportation New Orders MoM is at 0.89%, compared to 0.37% last month and 0.42% last year. This is higher than the long term average of 0.25%. |
| Report | Manufacturers' Shipments, Inventories, and Orders (M3) |
| Category | Manufacturing Business Statistics |
| Region | United States |
| Source | Census Bureau |
Stats
| Last Value | 0.89% |
| Latest Period | Feb 2026 |
| Last Updated | Apr 10 2026, 18:13 EDT |
| Next Release | May 28 2026, 10:00 EDT |
| Long Term Average | 0.25% |
| Average Growth Rate | -553.3% |
| Value from Last Month | 0.37% |
| Change from Last Month | 138.9% |
| Value from 1 Year Ago | 0.42% |
| Change from 1 Year Ago | 112.2% |
| Frequency | Monthly |
| Unit | Percent |
| Adjustment | Seasonally Adjusted |
| Download Source File |