

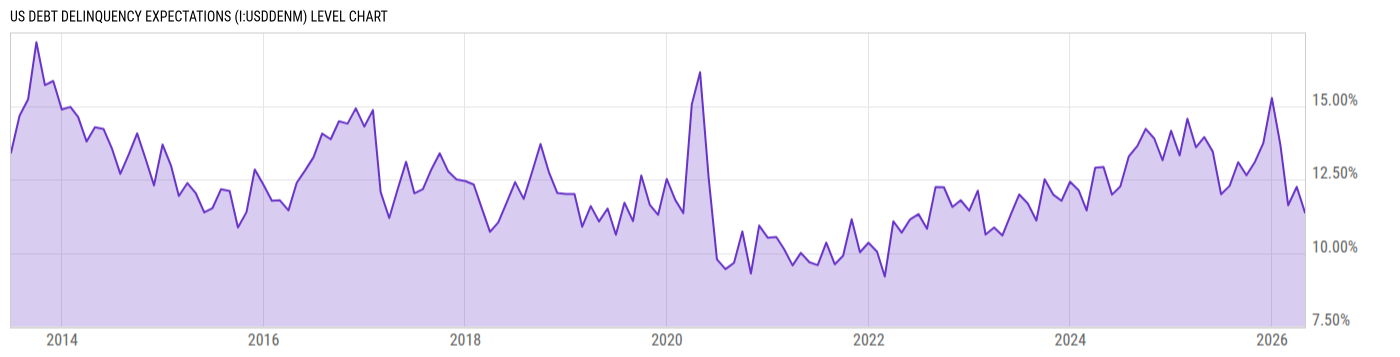
US Debt Delinquency Expectations (I:USDDENM)
11.37% for Apr 2026
Level Chart
Basic Info
|
US Debt Delinquency Expectations is at 11.37%, compared to 12.25% last month and 13.94% last year. This is lower than the long term average of 12.30%. |
| Report | Survey of Consumer Expectations |
| Category | Consumer & Household Statistics |
| Region | United States |
| Source | Federal Reserve Bank of New York |
Stats
| Last Value | 11.37% |
| Latest Period | Apr 2026 |
| Last Updated | May 7 2026, 11:03 EDT |
| Next Release | Jun 8 2026, 09:00 EDT (E) |
| Long Term Average | 12.30% |
| Average Growth Rate | 2.27% |
| Value from Last Month | 12.25% |
| Change from Last Month | -7.16% |
| Value from 1 Year Ago | 13.94% |
| Change from 1 Year Ago | -18.43% |
| Frequency | Monthly |
| Unit | Percent |
| Adjustment | N/A |
| Download Source File | |
| Notes | Mean probability of not being able to make minimum debt payment over the next three months. |
Historical Data
| Date | Value |
|---|---|
| April 30, 2026 | 11.37% |
| March 31, 2026 | 12.25% |
| February 28, 2026 | 11.62% |
| January 31, 2026 | 13.67% |
| December 31, 2025 | 15.27% |
| November 30, 2025 | 13.74% |
| October 31, 2025 | 13.11% |
| September 30, 2025 | 12.64% |
| August 31, 2025 | 13.09% |
| July 31, 2025 | 12.28% |
| June 30, 2025 | 12.00% |
| May 31, 2025 | 13.45% |
| April 30, 2025 | 13.94% |
| March 31, 2025 | 13.59% |
| February 28, 2025 | 14.56% |
| January 31, 2025 | 13.32% |
| December 31, 2024 | 14.16% |
| November 30, 2024 | 13.15% |
| October 31, 2024 | 13.90% |
| September 30, 2024 | 14.22% |
| August 31, 2024 | 13.64% |
| July 31, 2024 | 13.29% |
| June 30, 2024 | 12.26% |
| May 31, 2024 | 11.99% |
| April 30, 2024 | 12.93% |
| Date | Value |
|---|---|
| March 31, 2024 | 12.90% |
| February 29, 2024 | 11.45% |
| January 31, 2024 | 12.14% |
| December 31, 2023 | 12.42% |
| November 30, 2023 | 11.77% |
| October 31, 2023 | 11.99% |
| September 30, 2023 | 12.51% |
| August 31, 2023 | 11.11% |
| July 31, 2023 | 11.68% |
| June 30, 2023 | 11.99% |
| May 31, 2023 | 11.32% |
| April 30, 2023 | 10.60% |
| March 31, 2023 | 10.87% |
| February 28, 2023 | 10.63% |
| January 31, 2023 | 12.12% |
| December 31, 2022 | 11.44% |
| November 30, 2022 | 11.79% |
| October 31, 2022 | 11.56% |
| September 30, 2022 | 12.24% |
| August 31, 2022 | 12.25% |
| July 31, 2022 | 10.83% |
| June 30, 2022 | 11.32% |
| May 31, 2022 | 11.15% |
| April 30, 2022 | 10.69% |
| March 31, 2022 | 11.08% |
News
Headline
Time (ET)
04/24 14:16
04/20 07:46
Basic Info
|
US Debt Delinquency Expectations is at 11.37%, compared to 12.25% last month and 13.94% last year. This is lower than the long term average of 12.30%. |
| Report | Survey of Consumer Expectations |
| Category | Consumer & Household Statistics |
| Region | United States |
| Source | Federal Reserve Bank of New York |
Stats
| Last Value | 11.37% |
| Latest Period | Apr 2026 |
| Last Updated | May 7 2026, 11:03 EDT |
| Next Release | Jun 8 2026, 09:00 EDT (E) |
| Long Term Average | 12.30% |
| Average Growth Rate | 2.27% |
| Value from Last Month | 12.25% |
| Change from Last Month | -7.16% |
| Value from 1 Year Ago | 13.94% |
| Change from 1 Year Ago | -18.43% |
| Frequency | Monthly |
| Unit | Percent |
| Adjustment | N/A |
| Download Source File | |
| Notes | Mean probability of not being able to make minimum debt payment over the next three months. |