

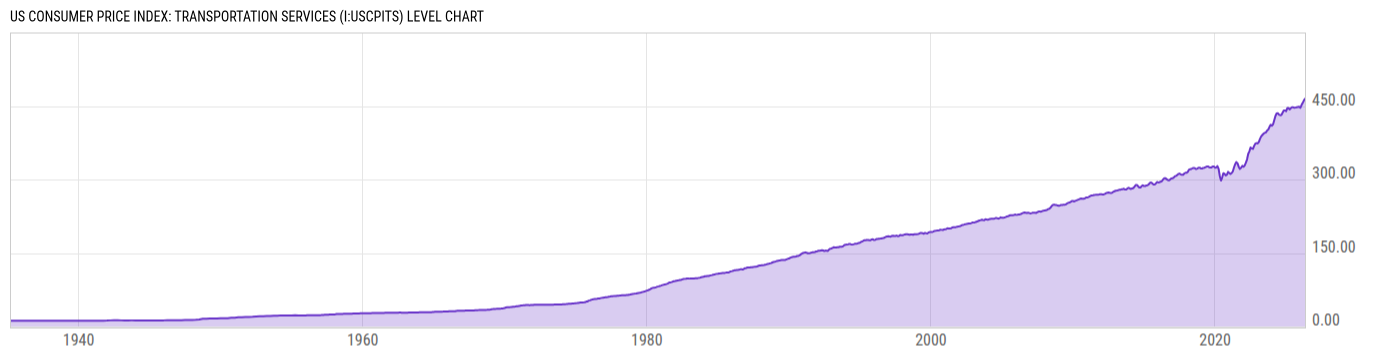
US Consumer Price Index: Transportation Services (I:USCPITS)
464.70 for Apr 2026
Level Chart
Basic Info
|
US Consumer Price Index: Transportation Services is at a current level of 464.70, up from 461.07 last month and up from 445.55 one year ago. This is a change of 0.79% from last month and 4.30% from one year ago. |
| Report | Consumer Price Index |
| Category | Consumer Prices |
| Region | United States |
| Source | Bureau of Labor Statistics |
Stats
| Last Value | 464.70 |
| Latest Period | Apr 2026 |
| Last Updated | May 13 2026, 11:13 EDT |
| Next Release | Jun 10 2026, 08:30 EDT |
| Average Growth Rate | 4.33% |
| Value from Last Month | 461.07 |
| Change from Last Month | 0.79% |
| Value from 1 Year Ago | 445.55 |
| Change from 1 Year Ago | 4.30% |
| Frequency | Monthly |
| Unit | Index 1982-84=100 |
| Adjustment | Not Seasonally Adjusted |
| Download Source File |
Historical Data
| Date | Value |
|---|---|
| April 30, 2026 | 464.70 |
| March 31, 2026 | 461.07 |
| February 28, 2026 | 455.91 |
| January 31, 2026 | 451.86 |
| December 31, 2025 | 446.14 |
| November 30, 2025 | 448.51 |
| October 31, 2025 | |
| September 30, 2025 | 447.45 |
| August 31, 2025 | 446.69 |
| July 31, 2025 | 446.42 |
| June 30, 2025 | 447.22 |
| May 31, 2025 | 447.54 |
| April 30, 2025 | 445.55 |
| March 31, 2025 | 442.90 |
| February 28, 2025 | 445.91 |
| January 31, 2025 | 445.85 |
| December 31, 2024 | 439.52 |
| November 30, 2024 | 440.98 |
| October 31, 2024 | 440.76 |
| September 30, 2024 | 436.33 |
| August 31, 2024 | 431.56 |
| July 31, 2024 | 431.20 |
| June 30, 2024 | 432.52 |
| May 31, 2024 | 435.30 |
| April 30, 2024 | 434.63 |
| Date | Value |
|---|---|
| March 31, 2024 | 429.59 |
| February 29, 2024 | 420.85 |
| January 31, 2024 | 412.64 |
| December 31, 2023 | 409.75 |
| November 30, 2023 | 411.89 |
| October 31, 2023 | 407.53 |
| September 30, 2023 | 402.02 |
| August 31, 2023 | 400.02 |
| July 31, 2023 | 396.20 |
| June 30, 2023 | 395.24 |
| May 31, 2023 | 393.84 |
| April 30, 2023 | 390.80 |
| March 31, 2023 | 387.97 |
| February 28, 2023 | 382.80 |
| January 31, 2023 | 376.74 |
| December 31, 2022 | 373.60 |
| November 30, 2022 | 374.25 |
| October 31, 2022 | 373.10 |
| September 30, 2022 | 368.64 |
| August 31, 2022 | 362.51 |
| July 31, 2022 | 363.39 |
| June 30, 2022 | 365.18 |
| May 31, 2022 | 357.44 |
| April 30, 2022 | 351.98 |
| March 31, 2022 | 340.67 |
News
Headline
Time (ET)
05/22 09:11
05/14 06:14
Basic Info
|
US Consumer Price Index: Transportation Services is at a current level of 464.70, up from 461.07 last month and up from 445.55 one year ago. This is a change of 0.79% from last month and 4.30% from one year ago. |
| Report | Consumer Price Index |
| Category | Consumer Prices |
| Region | United States |
| Source | Bureau of Labor Statistics |
Stats
| Last Value | 464.70 |
| Latest Period | Apr 2026 |
| Last Updated | May 13 2026, 11:13 EDT |
| Next Release | Jun 10 2026, 08:30 EDT |
| Average Growth Rate | 4.33% |
| Value from Last Month | 461.07 |
| Change from Last Month | 0.79% |
| Value from 1 Year Ago | 445.55 |
| Change from 1 Year Ago | 4.30% |
| Frequency | Monthly |
| Unit | Index 1982-84=100 |
| Adjustment | Not Seasonally Adjusted |
| Download Source File |