

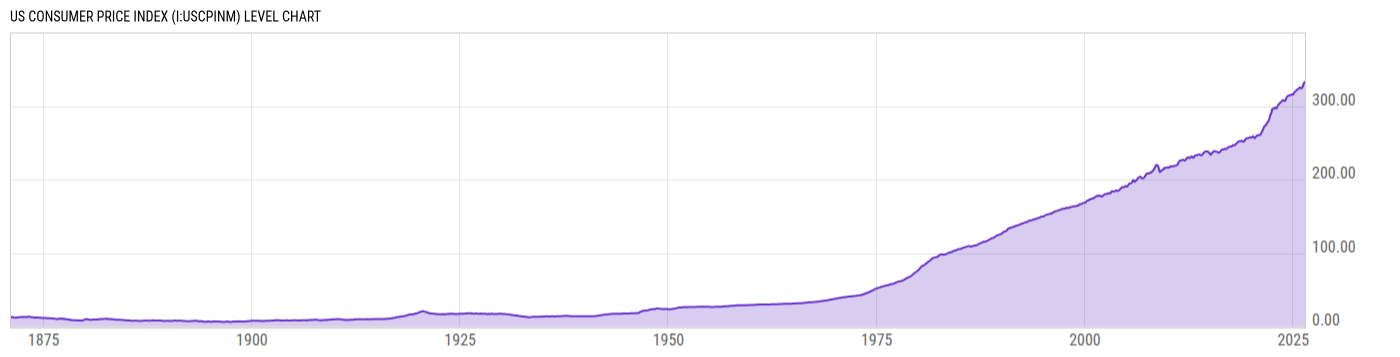
US Consumer Price Index (I:USCPINM)
332.78 for May 2026
Level Chart
Basic Info
|
US Consumer Price Index is at a current level of 332.78, up from 331.93 last month and up from 321.46 one year ago. This is a change of 0.26% from last month and 3.52% from one year ago. |
| Report | Shiller S&P 500 PE 10 |
| Category | Market Indices and Statistics |
| Region | United States |
| Source | Robert Shiller |
Stats
| Last Value | 332.78 |
| Latest Period | May 2026 |
| Last Updated | May 8 2026, 19:02 EDT |
| Next Release | Jun 8 2026, 19:00 EDT (E) |
| Average Growth Rate | 2.18% |
| Value from Last Month | 331.93 |
| Change from Last Month | 0.26% |
| Value from 1 Year Ago | 321.46 |
| Change from 1 Year Ago | 3.52% |
| Frequency | Monthly |
| Adjustment | N/A |
| Download Source File |
Historical Data
| Date | Value |
|---|---|
| May 31, 2026 | 332.78 |
| April 30, 2026 | 331.93 |
| March 31, 2026 | 330.21 |
| February 28, 2026 | 326.78 |
| January 31, 2026 | 325.25 |
| December 31, 2025 | 324.05 |
| November 30, 2025 | 324.12 |
| October 31, 2025 | 325.21 |
| September 30, 2025 | 324.80 |
| August 31, 2025 | 323.98 |
| July 31, 2025 | 323.05 |
| June 30, 2025 | 322.56 |
| May 31, 2025 | 321.46 |
| April 30, 2025 | 320.80 |
| March 31, 2025 | 319.80 |
| February 28, 2025 | 319.08 |
| January 31, 2025 | 317.67 |
| December 31, 2024 | 315.60 |
| November 30, 2024 | 315.49 |
| October 31, 2024 | 315.66 |
| September 30, 2024 | 315.30 |
| August 31, 2024 | 314.80 |
| July 31, 2024 | 314.54 |
| June 30, 2024 | 314.18 |
| May 31, 2024 | 314.07 |
| Date | Value |
|---|---|
| April 30, 2024 | 313.55 |
| March 31, 2024 | 312.33 |
| February 29, 2024 | 310.33 |
| January 31, 2024 | 308.42 |
| December 31, 2023 | 306.75 |
| November 30, 2023 | 307.05 |
| October 31, 2023 | 307.67 |
| September 30, 2023 | 307.79 |
| August 31, 2023 | 307.03 |
| July 31, 2023 | 305.69 |
| June 30, 2023 | 305.11 |
| May 31, 2023 | 304.13 |
| April 30, 2023 | 303.36 |
| March 31, 2023 | 301.84 |
| February 28, 2023 | 300.84 |
| January 31, 2023 | 299.17 |
| December 31, 2022 | 296.80 |
| November 30, 2022 | 297.71 |
| October 31, 2022 | 298.01 |
| September 30, 2022 | 296.81 |
| August 31, 2022 | 296.17 |
| July 31, 2022 | 296.28 |
| June 30, 2022 | 296.31 |
| May 31, 2022 | 292.30 |
| April 30, 2022 | 289.11 |
News
Headline
Time (ET)
05/13 15:57
Basic Info
|
US Consumer Price Index is at a current level of 332.78, up from 331.93 last month and up from 321.46 one year ago. This is a change of 0.26% from last month and 3.52% from one year ago. |
| Report | Shiller S&P 500 PE 10 |
| Category | Market Indices and Statistics |
| Region | United States |
| Source | Robert Shiller |
Stats
| Last Value | 332.78 |
| Latest Period | May 2026 |
| Last Updated | May 8 2026, 19:02 EDT |
| Next Release | Jun 8 2026, 19:00 EDT (E) |
| Average Growth Rate | 2.18% |
| Value from Last Month | 331.93 |
| Change from Last Month | 0.26% |
| Value from 1 Year Ago | 321.46 |
| Change from 1 Year Ago | 3.52% |
| Frequency | Monthly |
| Adjustment | N/A |
| Download Source File |