

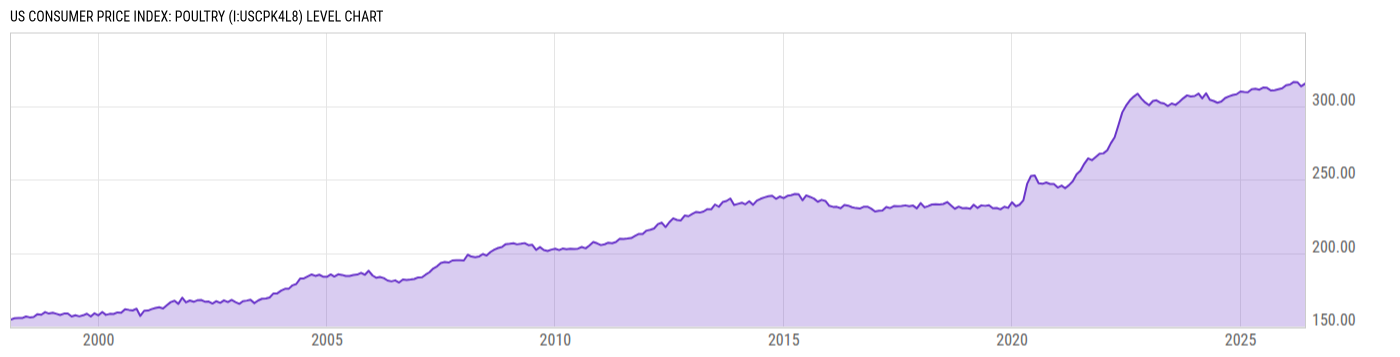
US Consumer Price Index: Poultry (I:USCPK4L8)
312.14 for Jun 2026
Level Chart
Basic Info
|
US Consumer Price Index: Poultry is at a current level of 312.14, down from 315.17 last month and down from 312.54 one year ago. This is a change of -0.96% from last month and -0.13% from one year ago. |
| Report | Consumer Price Index |
| Category | Consumer Prices |
| Region | United States |
| Source | Bureau of Labor Statistics |
Stats
| Last Value | 312.14 |
| Latest Period | Jun 2026 |
| Last Updated | Jul 14 2026, 09:15 EDT |
| Next Release | Aug 12 2026, 08:30 EDT |
| Average Growth Rate | 2.52% |
| Value from Last Month | 315.17 |
| Change from Last Month | -0.96% |
| Value from 1 Year Ago | 312.54 |
| Change from 1 Year Ago | -0.13% |
| Frequency | Monthly |
| Unit | Index 1982-84=100 |
| Adjustment | Seasonally Adjusted |
| Download Source File |
Historical Data
| Date | Value |
|---|---|
| June 30, 2026 | 312.14 |
| May 31, 2026 | 315.17 |
| April 30, 2026 | 313.38 |
| March 31, 2026 | 316.22 |
| February 28, 2026 | 316.28 |
| January 31, 2026 | 314.58 |
| December 31, 2025 | 314.17 |
| November 30, 2025 | 312.02 |
| October 31, 2025 | |
| September 30, 2025 | 310.74 |
| August 31, 2025 | 310.51 |
| July 31, 2025 | 312.37 |
| June 30, 2025 | 312.54 |
| May 31, 2025 | 311.12 |
| April 30, 2025 | 311.72 |
| March 31, 2025 | 311.44 |
| February 28, 2025 | 309.33 |
| January 31, 2025 | 309.52 |
| December 31, 2024 | 309.83 |
| November 30, 2024 | 307.99 |
| October 31, 2024 | 307.51 |
| September 30, 2024 | 306.51 |
| August 31, 2024 | 305.47 |
| July 31, 2024 | 303.01 |
| June 30, 2024 | 302.23 |
| Date | Value |
|---|---|
| May 31, 2024 | 303.41 |
| April 30, 2024 | 304.27 |
| March 31, 2024 | 308.62 |
| February 29, 2024 | 305.19 |
| January 31, 2024 | 308.48 |
| December 31, 2023 | 306.81 |
| November 30, 2023 | 306.42 |
| October 31, 2023 | 307.22 |
| September 30, 2023 | 305.21 |
| August 31, 2023 | 302.84 |
| July 31, 2023 | 300.77 |
| June 30, 2023 | 301.69 |
| May 31, 2023 | 299.97 |
| April 30, 2023 | 301.69 |
| March 31, 2023 | 302.28 |
| February 28, 2023 | 303.84 |
| January 31, 2023 | 303.39 |
| December 31, 2022 | 300.49 |
| November 30, 2022 | 302.43 |
| October 31, 2022 | 305.02 |
| September 30, 2022 | 308.37 |
| August 31, 2022 | 306.40 |
| July 31, 2022 | 303.88 |
| June 30, 2022 | 300.21 |
| May 31, 2022 | 295.67 |
News
Headline
Time (ET)
07/31 13:23
07/24 09:26
Basic Info
|
US Consumer Price Index: Poultry is at a current level of 312.14, down from 315.17 last month and down from 312.54 one year ago. This is a change of -0.96% from last month and -0.13% from one year ago. |
| Report | Consumer Price Index |
| Category | Consumer Prices |
| Region | United States |
| Source | Bureau of Labor Statistics |
Stats
| Last Value | 312.14 |
| Latest Period | Jun 2026 |
| Last Updated | Jul 14 2026, 09:15 EDT |
| Next Release | Aug 12 2026, 08:30 EDT |
| Average Growth Rate | 2.52% |
| Value from Last Month | 315.17 |
| Change from Last Month | -0.96% |
| Value from 1 Year Ago | 312.54 |
| Change from 1 Year Ago | -0.13% |
| Frequency | Monthly |
| Unit | Index 1982-84=100 |
| Adjustment | Seasonally Adjusted |
| Download Source File |