

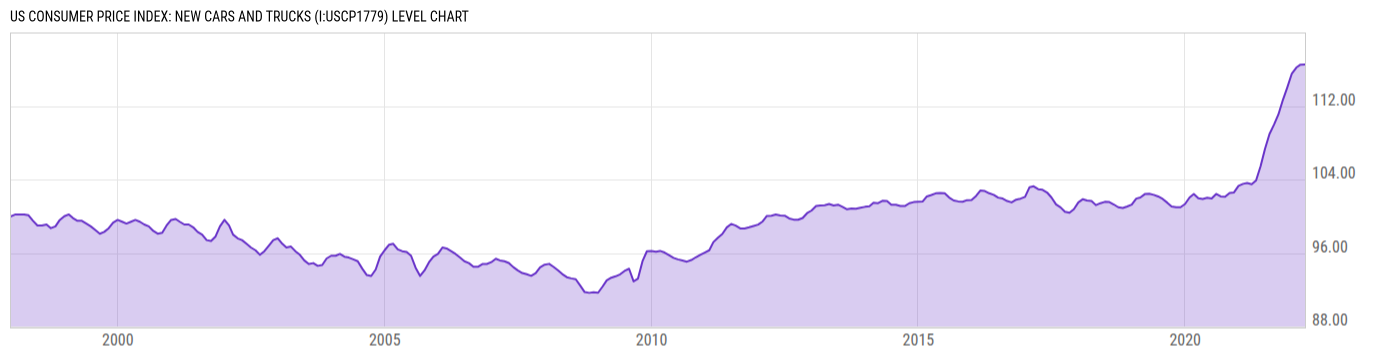
US Consumer Price Index: New Cars and Trucks (I:USCP1779)
116.52 for Mar 2022
Level Chart
Basic Info
|
US Consumer Price Index: New Cars and Trucks is at a current level of 116.52, up from 116.50 last month and up from 103.49 one year ago. This is a change of 0.02% from last month and 12.59% from one year ago. |
| Report | Consumer Price Index |
| Category | Consumer Prices |
| Region | N/A |
| Source | Bureau of Labor Statistics |
Stats
| Last Value | 116.52 |
| Latest Period | Mar 2022 |
| Last Updated | Apr 12 2022, 12:33 EDT |
| Next Release | Aug 12 2026, 12:30 EDT |
| Average Growth Rate | 0.64% |
| Value from Last Month | 116.50 |
| Change from Last Month | 0.02% |
| Value from 1 Year Ago | 103.49 |
| Change from 1 Year Ago | 12.59% |
| Frequency | Monthly |
| Unit | Index December 1997=100 |
| Adjustment | Not Seasonally Adjusted |
| Download Source File |
Historical Data
| Date | Value |
|---|---|
| March 31, 2022 | 116.52 |
| February 28, 2022 | 116.50 |
| January 31, 2022 | 116.18 |
| December 31, 2021 | 115.53 |
| November 30, 2021 | 114.04 |
| October 31, 2021 | 112.67 |
| September 30, 2021 | 111.08 |
| August 31, 2021 | 109.97 |
| July 31, 2021 | 108.96 |
| June 30, 2021 | 107.33 |
| May 31, 2021 | 105.45 |
| April 30, 2021 | 103.89 |
| March 31, 2021 | 103.49 |
| February 28, 2021 | 103.62 |
| January 31, 2021 | 103.53 |
| December 31, 2020 | 103.31 |
| November 30, 2020 | 102.60 |
| October 31, 2020 | 102.54 |
| September 30, 2020 | 102.12 |
| August 31, 2020 | 102.15 |
| July 31, 2020 | 102.42 |
| June 30, 2020 | 101.94 |
| May 31, 2020 | 102.02 |
| April 30, 2020 | 101.88 |
| March 31, 2020 | 101.96 |
| Date | Value |
|---|---|
| February 29, 2020 | 102.43 |
| January 31, 2020 | 102.05 |
| December 31, 2019 | 101.33 |
| November 30, 2019 | 100.98 |
| October 31, 2019 | 100.98 |
| September 30, 2019 | 101.07 |
| August 31, 2019 | 101.48 |
| July 31, 2019 | 101.88 |
| June 30, 2019 | 102.16 |
| May 31, 2019 | 102.33 |
| April 30, 2019 | 102.45 |
| March 31, 2019 | 102.41 |
| February 28, 2019 | 102.03 |
| January 31, 2019 | 101.92 |
| December 31, 2018 | 101.27 |
| November 30, 2018 | 101.06 |
| October 31, 2018 | 100.90 |
| September 30, 2018 | 100.98 |
| August 31, 2018 | 101.28 |
| July 31, 2018 | 101.54 |
| June 30, 2018 | 101.57 |
| May 31, 2018 | 101.42 |
| April 30, 2018 | 101.21 |
| March 31, 2018 | 101.66 |
| February 28, 2018 | 101.72 |
News
Headline
Time (ET)
06/26 14:18
06/22 09:15
Basic Info
|
US Consumer Price Index: New Cars and Trucks is at a current level of 116.52, up from 116.50 last month and up from 103.49 one year ago. This is a change of 0.02% from last month and 12.59% from one year ago. |
| Report | Consumer Price Index |
| Category | Consumer Prices |
| Region | N/A |
| Source | Bureau of Labor Statistics |
Stats
| Last Value | 116.52 |
| Latest Period | Mar 2022 |
| Last Updated | Apr 12 2022, 12:33 EDT |
| Next Release | Aug 12 2026, 12:30 EDT |
| Average Growth Rate | 0.64% |
| Value from Last Month | 116.50 |
| Change from Last Month | 0.02% |
| Value from 1 Year Ago | 103.49 |
| Change from 1 Year Ago | 12.59% |
| Frequency | Monthly |
| Unit | Index December 1997=100 |
| Adjustment | Not Seasonally Adjusted |
| Download Source File |