

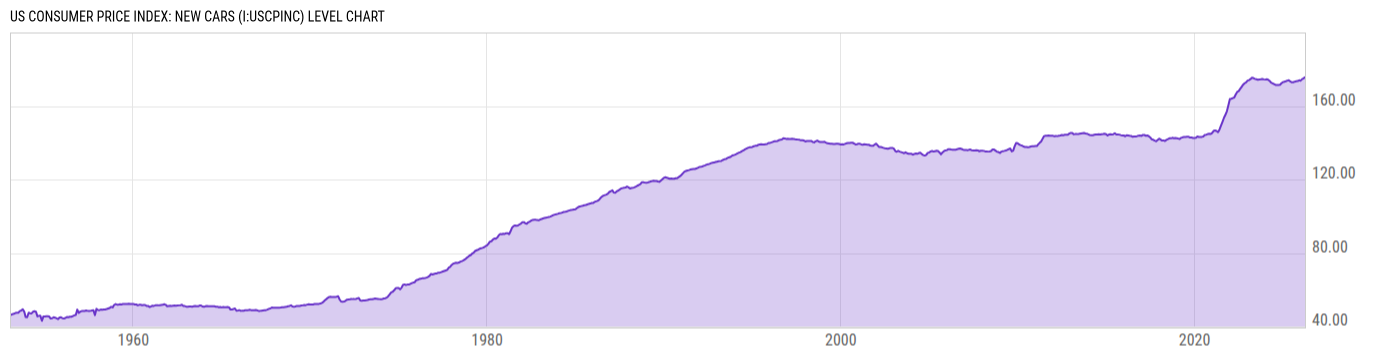
US Consumer Price Index: New Cars (I:USCPINC)
175.60 for Mar 2026
Level Chart
Basic Info
|
US Consumer Price Index: New Cars is at a current level of 175.60, up from 175.01 last month and up from 173.81 one year ago. This is a change of 0.34% from last month and 1.03% from one year ago. |
| Report | Consumer Price Index |
| Category | Consumer Prices |
| Region | N/A |
| Source | Bureau of Labor Statistics |
Stats
| Last Value | 175.60 |
| Latest Period | Mar 2026 |
| Last Updated | Apr 10 2026, 12:37 EDT |
| Next Release | May 12 2026, 12:30 EDT |
| Average Growth Rate | 1.86% |
| Value from Last Month | 175.01 |
| Change from Last Month | 0.34% |
| Value from 1 Year Ago | 173.81 |
| Change from 1 Year Ago | 1.03% |
| Frequency | Monthly |
| Unit | Index 1982-84=100 |
| Adjustment | Seasonally Adjusted |
| Download Source File |
Historical Data
| Date | Value |
|---|---|
| March 31, 2026 | 175.60 |
| February 28, 2026 | 175.01 |
| January 31, 2026 | 174.61 |
| December 31, 2025 | 173.79 |
| November 30, 2025 | 174.00 |
| October 31, 2025 | 173.56 |
| September 30, 2025 | 173.42 |
| August 31, 2025 | 173.23 |
| July 31, 2025 | 172.91 |
| June 30, 2025 | 172.91 |
| May 31, 2025 | 173.34 |
| April 30, 2025 | 174.00 |
| March 31, 2025 | 173.81 |
| February 28, 2025 | 173.46 |
| January 31, 2025 | 173.23 |
| December 31, 2024 | 172.99 |
| November 30, 2024 | 172.41 |
| October 31, 2024 | 171.56 |
| September 30, 2024 | 171.45 |
| August 31, 2024 | 171.44 |
| July 31, 2024 | 171.44 |
| June 30, 2024 | 171.90 |
| May 31, 2024 | 172.34 |
| April 30, 2024 | 172.68 |
| March 31, 2024 | 173.65 |
| Date | Value |
|---|---|
| February 29, 2024 | 174.28 |
| January 31, 2024 | 174.55 |
| December 31, 2023 | 174.36 |
| November 30, 2023 | 174.50 |
| October 31, 2023 | 174.73 |
| September 30, 2023 | 174.57 |
| August 31, 2023 | 174.44 |
| July 31, 2023 | 174.28 |
| June 30, 2023 | 174.52 |
| May 31, 2023 | 174.76 |
| April 30, 2023 | 175.19 |
| March 31, 2023 | 175.36 |
| February 28, 2023 | 174.61 |
| January 31, 2023 | 174.11 |
| December 31, 2022 | 173.79 |
| November 30, 2022 | 172.89 |
| October 31, 2022 | 172.39 |
| September 30, 2022 | 171.61 |
| August 31, 2022 | 170.45 |
| July 31, 2022 | 169.29 |
| June 30, 2022 | 168.12 |
| May 31, 2022 | 167.63 |
| April 30, 2022 | 166.28 |
| March 31, 2022 | 164.64 |
| February 28, 2022 | 164.31 |
News
Headline
Time (ET)
04/21 12:24
04/20 11:18
04/20 08:46
04/20 07:46
04/20 07:26
Basic Info
|
US Consumer Price Index: New Cars is at a current level of 175.60, up from 175.01 last month and up from 173.81 one year ago. This is a change of 0.34% from last month and 1.03% from one year ago. |
| Report | Consumer Price Index |
| Category | Consumer Prices |
| Region | N/A |
| Source | Bureau of Labor Statistics |
Stats
| Last Value | 175.60 |
| Latest Period | Mar 2026 |
| Last Updated | Apr 10 2026, 12:37 EDT |
| Next Release | May 12 2026, 12:30 EDT |
| Average Growth Rate | 1.86% |
| Value from Last Month | 175.01 |
| Change from Last Month | 0.34% |
| Value from 1 Year Ago | 173.81 |
| Change from 1 Year Ago | 1.03% |
| Frequency | Monthly |
| Unit | Index 1982-84=100 |
| Adjustment | Seasonally Adjusted |
| Download Source File |