

US Consumer Price Index: Fuel Oil And Other Fuels (I:USCPDANU)
442.71 for Mar 2026
Level Chart
Basic Info
|
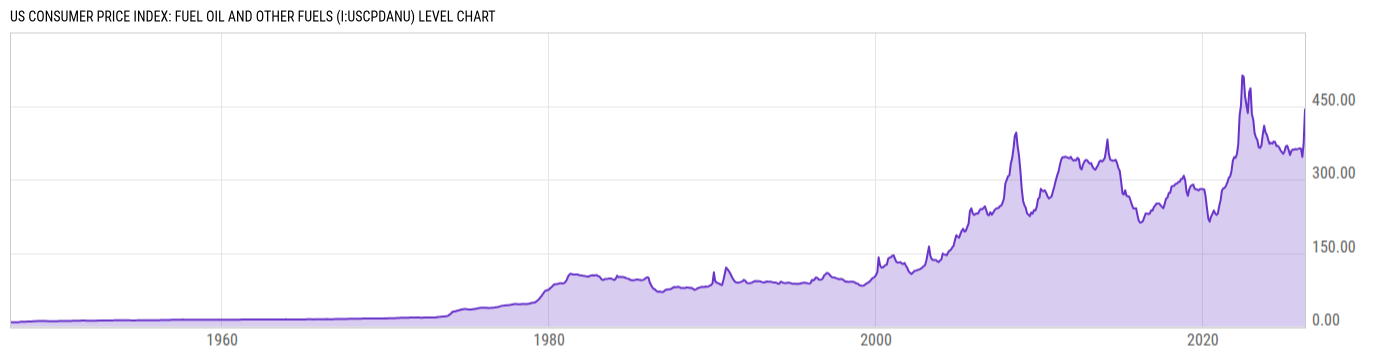
US Consumer Price Index: Fuel Oil And Other Fuels is at a current level of 442.71, up from 372.62 last month and up from 360.18 one year ago. This is a change of 18.81% from last month and 22.92% from one year ago. |
| Report | Consumer Price Index |
| Category | Consumer Prices |
| Region | United States |
| Source | Bureau of Labor Statistics |
Stats
| Last Value | 442.71 |
| Latest Period | Mar 2026 |
| Last Updated | Apr 10 2026, 08:50 EDT |
| Next Release | May 12 2026, 08:30 EDT |
| Average Growth Rate | 5.55% |
| Value from Last Month | 372.62 |
| Change from Last Month | 18.81% |
| Value from 1 Year Ago | 360.18 |
| Change from 1 Year Ago | 22.92% |
| Frequency | Monthly |
| Unit | Index 1982-84=100 |
| Adjustment | Seasonally Adjusted |
| Download Source File |
Historical Data
| Date | Value |
|---|---|
| March 31, 2026 | 442.71 |
| February 28, 2026 | 372.62 |
| January 31, 2026 | 346.04 |
| December 31, 2025 | 363.03 |
| November 30, 2025 | 363.66 |
| October 31, 2025 | |
| September 30, 2025 | 361.46 |
| August 31, 2025 | 362.29 |
| July 31, 2025 | 360.96 |
| June 30, 2025 | 361.10 |
| May 31, 2025 | 358.38 |
| April 30, 2025 | 350.17 |
| March 31, 2025 | 360.18 |
| February 28, 2025 | 368.73 |
| January 31, 2025 | 368.06 |
| December 31, 2024 | 358.44 |
| November 30, 2024 | 352.43 |
| October 31, 2024 | 355.94 |
| September 30, 2024 | 359.57 |
| August 31, 2024 | 365.68 |
| July 31, 2024 | 368.65 |
| June 30, 2024 | 368.46 |
| May 31, 2024 | 376.53 |
| April 30, 2024 | 377.48 |
| March 31, 2024 | 372.86 |
| Date | Value |
|---|---|
| February 29, 2024 | 374.82 |
| January 31, 2024 | 372.85 |
| December 31, 2023 | 380.98 |
| November 30, 2023 | 391.36 |
| October 31, 2023 | 395.88 |
| September 30, 2023 | 409.78 |
| August 31, 2023 | 391.91 |
| July 31, 2023 | 369.25 |
| June 30, 2023 | 364.58 |
| May 31, 2023 | 366.23 |
| April 30, 2023 | 381.07 |
| March 31, 2023 | 385.65 |
| February 28, 2023 | 395.12 |
| January 31, 2023 | 421.63 |
| December 31, 2022 | 433.40 |
| November 30, 2022 | 485.98 |
| October 31, 2022 | 478.73 |
| September 30, 2022 | 435.76 |
| August 31, 2022 | 451.84 |
| July 31, 2022 | 469.84 |
| June 30, 2022 | 509.85 |
| May 31, 2022 | 512.25 |
| April 30, 2022 | 450.66 |
| March 31, 2022 | 430.75 |
| February 28, 2022 | 371.65 |
News
Headline
Time (ET)
04/21 12:24
04/20 11:18
04/20 08:46
04/20 07:46
04/20 07:26
Basic Info
|
US Consumer Price Index: Fuel Oil And Other Fuels is at a current level of 442.71, up from 372.62 last month and up from 360.18 one year ago. This is a change of 18.81% from last month and 22.92% from one year ago. |
| Report | Consumer Price Index |
| Category | Consumer Prices |
| Region | United States |
| Source | Bureau of Labor Statistics |
Stats
| Last Value | 442.71 |
| Latest Period | Mar 2026 |
| Last Updated | Apr 10 2026, 08:50 EDT |
| Next Release | May 12 2026, 08:30 EDT |
| Average Growth Rate | 5.55% |
| Value from Last Month | 372.62 |
| Change from Last Month | 18.81% |
| Value from 1 Year Ago | 360.18 |
| Change from 1 Year Ago | 22.92% |
| Frequency | Monthly |
| Unit | Index 1982-84=100 |
| Adjustment | Seasonally Adjusted |
| Download Source File |